Amino Acids
Amino Acid Profiling by UPLC–MS/MS
| Specification | MetwareBio Amino Acid Assay |
|---|---|
| Analytical platform | UPLC–MS/MS |
| Instrument | SCIEX QTRAP 6500+ tandem mass spectrometer |
| Acquisition mode | Multiple reaction monitoring (MRM); positive and negative ion modes |
| Target analytes | 93 amino acids and related metabolites |
| Quantification | Absolute quantification |
| Calibration strategy | External calibration (r > 0.99); internal-standard correction for applicable analytes |
Why Choose MetwareBio for Amino Acid Analysis?
Broad Amino Acid Panel Coverage
Sensitive UPLC–MS/MS MRM Detection
Accurate Absolute Quantification
Rigorous Quality Control for Reproducible Results
Multi-Omics Integration for Systems-Level Insights
Amino Acid Panel Coverage: 93 Target Analytes
MetwareBio’s amino acid targeted metabolomics panel provides absolute quantification of 93 amino acids and related metabolites, covering a broad range of proteinogenic and non-proteinogenic amino acids, modified amino acids, amino acid derivatives, small peptides, biogenic amines, and selected organic acids. Representative compounds include branched-chain amino acids (BCAAs), aromatic amino acids, sulfur-containing amino acids, and metabolites associated with the urea cycle, tryptophan–kynurenine pathway, and glutathione metabolism. The panel also includes neurotransmitter-related compounds such as γ-aminobutyric acid (GABA) and serotonin, as well as bioactive peptides including carnosine and anserine, enabling comprehensive investigation of amino acid metabolism and its interconnected biochemical pathways.
| Compound Category | Representative Analytes | Research Relevance |
| Proteinogenic Amino Acids | Glycine, alanine, valine, leucine, isoleucine, methionine, proline, serine, threonine, tryptophan, phenylalanine, tyrosine, cysteine, glutamate, aspartate, asparagine, glutamine, lysine, histidine, arginine | Protein synthesis, amino acid homeostasis, and nutrient metabolism |
| Non-Proteinogenic Amino Acids and Analogues | β-Alanine, sarcosine, citrulline, ornithine, homoserine, homocitrulline, pipecolic acid, theanine, homoarginine, GABA, 2-aminobutyric acid, β-aminoisobutyric acid, α-aminoadipic acid | Nitrogen metabolism, urea-cycle activity, and amino acid-related signaling |
| Modified Amino Acids and Derivatives | N-Acetyl-L-lysine, N-Acetyl-L-arginine, N-Acetyl-L-glutamine, N-Acetyl-L-tyrosine, N-Acetylaspartate, 5-hydroxylysine, hydroxyproline, 3-methylhistidine, 3-iodotyrosine, 3-chlorotyrosine, O-phosphoserine | Amino acid modification, protein turnover, and metabolic regulation |
| Sulfur-Containing Amino Acid Metabolites | Cystine, cystathionine, homocysteine-related compounds, methionine sulfoxide, S-sulfocysteine, S-adenosylhomocysteine (SAH), taurine | Methionine metabolism, transsulfuration, and redox homeostasis |
| Peptides and Peptide-Derived Compounds | Carnosine, anserine, glycylproline, glycylphenylalanine, glycylleucine, Asp-Phe, Trp-Glu, γ-glutamylcysteine, oxidized glutathione | Peptide metabolism, protein turnover, and antioxidant defense |
| Tryptophan-Derived Metabolites | Kynurenine, kynurenic acid, N-formylkynurenine, 5-hydroxytryptamine (serotonin) | Tryptophan catabolism and related metabolic pathways |
| Other Nitrogen-Containing Metabolites and Related Small Molecules | Creatine, urea, succinic acid, trimethylamine N-oxide, ethanolamine, phosphorylethanolamine, N8-acetylspermidine, N-acetylneuraminic acid, selected uric acid and hippurate derivatives | Nitrogen metabolism, energy metabolism, and interconnected biochemical processes |
Amino Acid Quantification Workflow




Quantification

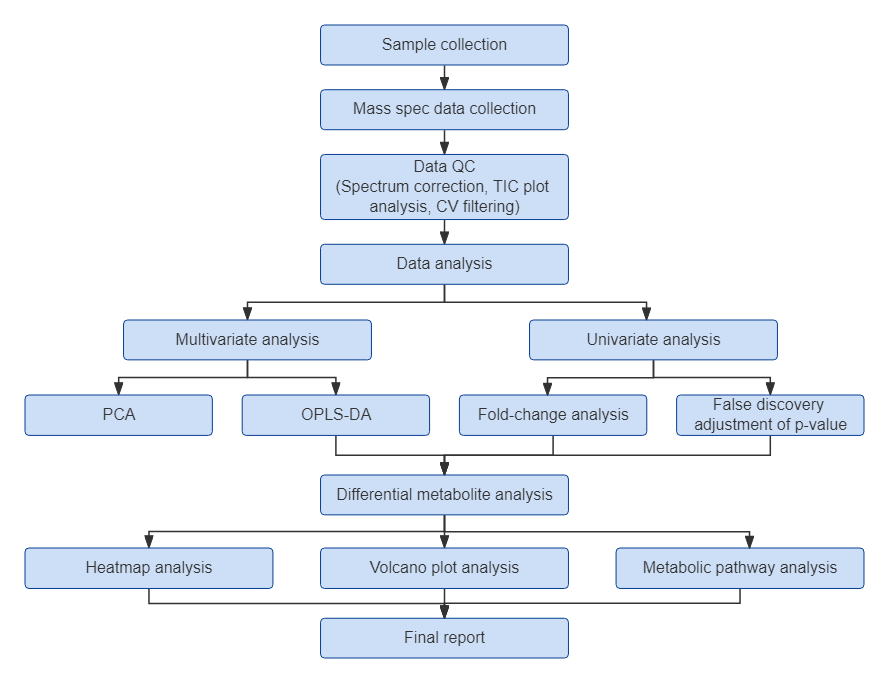
Step-by-Step Workflow of MetwareBio’s Amino Acid Targeted Metabolomics
Amino Acid Data Analysis and Deliverables
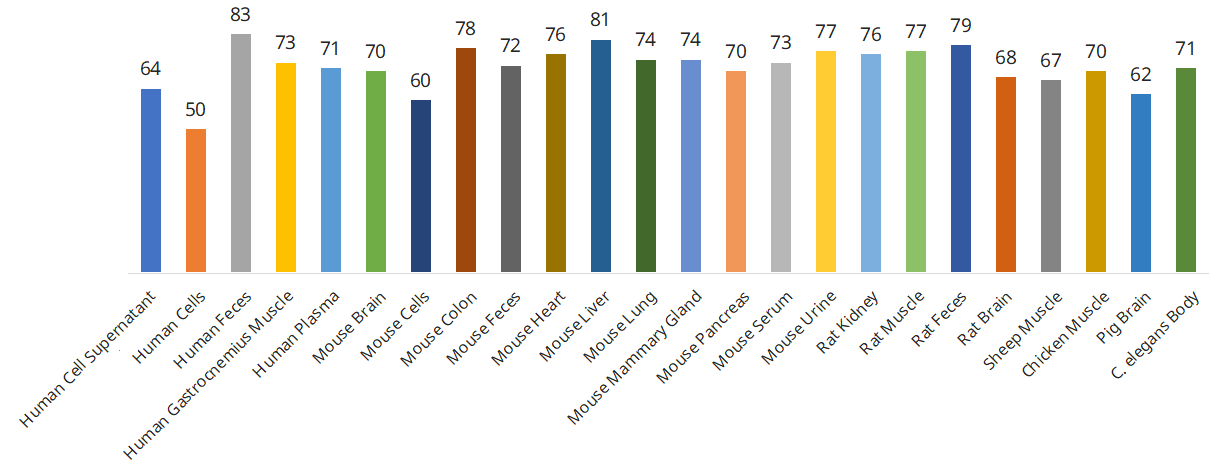
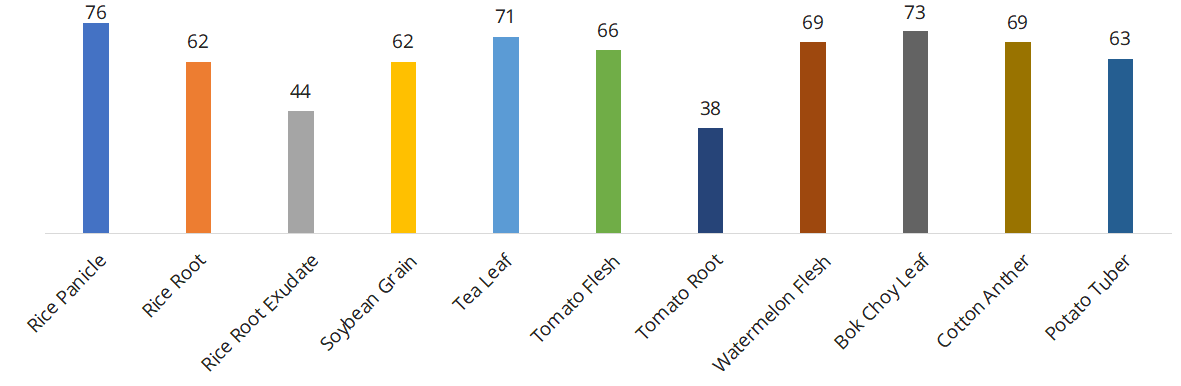
Amino Acid Profiling: Project Experience and Detection Performance
Applications of Amino Acid Targeted Metabolomics
Human Metabolic Health and Disease Research
Amino acid profiles are closely associated with systemic metabolic regulation and can change during disease development. Targeted amino acid profiling helps characterize metabolic alterations associated with diabetes, obesity, cardiovascular disorders, liver and kidney diseases, and cancer, supporting metabolic biomarker discovery and disease mechanism research.
Animal Nutrition and Growth Performance
Amino acids are essential for protein synthesis, nitrogen balance, and animal growth. Targeted amino acid analysis supports research on feed nutrition, amino acid utilization, muscle development, growth performance, and metabolic responses to dietary interventions, providing insights into animal nutrition and physiological health.
Plant Growth and Stress Adaptation
Amino acids contribute to nitrogen assimilation, carbon–nitrogen balance, osmotic adjustment, and plant defense responses. Targeted profiling helps investigate metabolic changes during plant growth and development, as well as responses to drought, salinity, nutrient deficiency, and other environmental stresses.
Microbial Amino Acid Metabolism and Fermentation
Amino acid metabolism is closely involved in microbial growth, nitrogen utilization, and fermentation processes. Targeted amino acid profiling helps characterize metabolic differences among microbial strains and culture conditions, supporting research on microbial physiology, fermentation optimization, and host–microbiome metabolic interactions.
Food Quality and Nutritional Composition
Amino acid composition is an important indicator of the nutritional characteristics and quality of food materials. Targeted amino acid analysis enables comparisons of amino acid profiles across food varieties, raw materials, and processing conditions, supporting nutritional evaluation, food quality assessment, and functional food research.
Published Case Study of Amino Acid Profiling
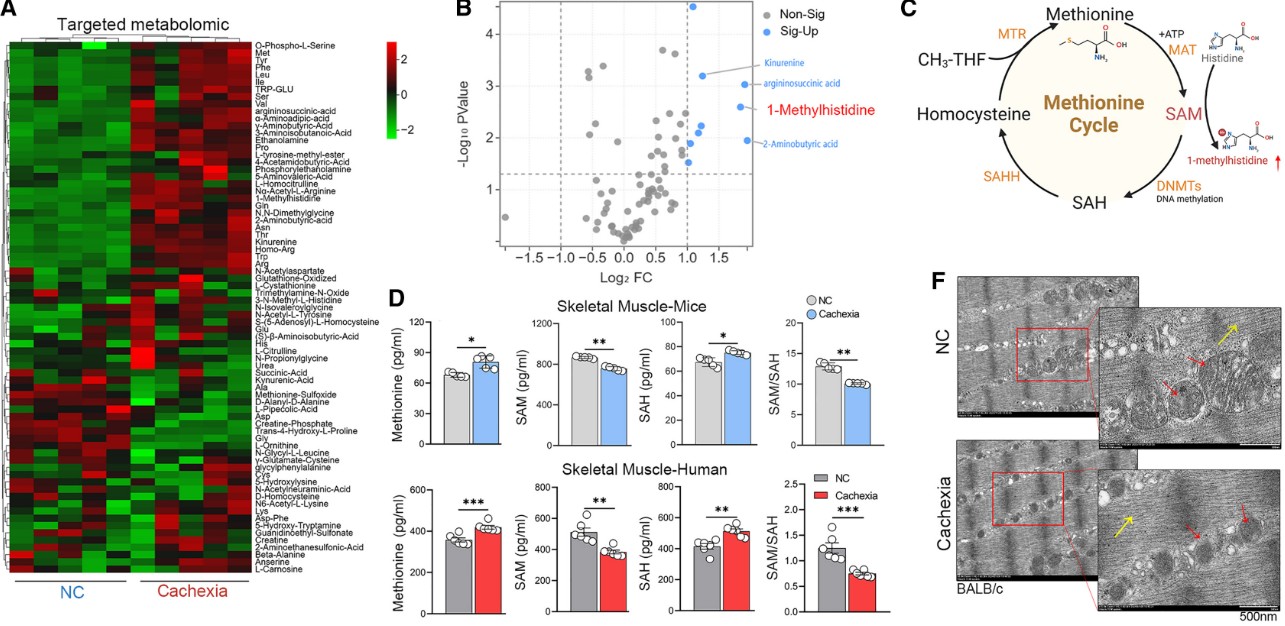
Targeted Amino Acid Profiling Reveals Metabolic Alterations in Cancer Cachexia-Associated Muscle Atrophy
Cancer cachexia is characterized by progressive skeletal muscle wasting and metabolic disturbances. In the study “Disrupted methionine cycle triggers muscle atrophy in cancer cachexia through epigenetic regulation of REDD1,” researchers investigated how methionine metabolism contributes to muscle atrophy in cancer cachexia. MetwareBio performed targeted amino acid profiling of mouse skeletal muscle samples, identifying significant metabolic alterations, including increased levels of 1-methylhistidine, kynurenine, and 2-aminobutyric acid. Complementary ELISA measurements in the study further demonstrated increased methionine and SAH levels, accompanied by decreased SAM levels, indicating disrupted methionine-cycle homeostasis. Together with transcriptomic and epigenetic analyses, these metabolic findings contributed to the identification of the DNMT3A–Ddit4/REDD1 regulatory axis, revealing how amino acid metabolic disturbances are linked to impaired DNA methylation and cancer cachexia-associated muscle atrophy. The findings highlight the importance of amino acid metabolic profiling in investigating disease-related metabolic dysfunction and potential nutritional intervention strategies.
Sample Requirements for Amino Acid Analysis
| Sample Type (examples) | Recommended Input | Minimum Input |
| Plant Tissue (Root, Stem, Leaf, Fruit, Flower, Bud, Node, Callus, Seed) | 600 mg | 300 mg |
| Plasma, Serum, Hemolymph, Whole Blood, Milk, Egg White | 100 µL | 20 µL |
| Cerebrospinal Fluid (CSF), Interstitial Fluid (TIF), Uterine Fluid, Pancreatic Juice, Bile, Pleural Effusion, Follicular Fluid, Fallopian Tube Fluid, Postmortem Fluid, Tissue Fluid, Culture Medium (liquid), Culture Supernatant, Fermentation Broth, Tears, Aqueous Humor, Digestive Juices, Bone Marrow (liquid) | 100 µL | 50 µL |
| Seminal Plasma, Amniotic Fluid, Prostatic Fluid, Rumen Fluid, Respiratory Condensate, Gastric Lavage Fluid, Bronchoalveolar Lavage Fluid (BALF), Urine, Sweat, Saliva, Sputum | 500 µL | 50 µL |
| Small Animal Tissues, Placenta, Blood Clot, Mycelium, Nematode, Zebrafish (whole fish), Bone Marrow (solid), Nail | 100 mg | 50 mg |
| Large Animal Tissues, Whole Insect Body, Wings (of insects), Pupa, Eggs, Large Fungi (mushroom types), Large Amount of Fungal Mycelium/Mycelial Balls, Cartilage, Bone | 500 mg | 50 mg |
| Zebrafish Organs, Insect Organs, Whole Microinsect Body (e.g., Drosophila) | 20 units | / |
| Feces, Intestinal Contents, Lyophilized Fecal Powder | 200 mg | 50 mg |
| Adherent Cells, Animal Cell Lines | 1 × 10⁶ cells | 5 × 10⁵ cells |
| E. Coli, Yeast Cells | 1 × 10¹⁰ cells | 5 × 10⁸ cells |
| Specialized Microbial Biomass (e.g., small mycelial samples, cyanobacteria, bacterial pellets, microbial sludge/dry powder) | 100 mg | / |
| Lysosomes, Mitochondria, Endoplasmic Reticulum | 4 × 10⁷ cells or 0.2 g tissue | 1 × 10⁷ cells or 0.1 g tissue |
| Exosomes, Extracellular Vesicles | 2 × 10⁹ particles (NTA) and 40 µg protein (BCA) | 1 × 10⁹ particles (NTA) and 20 µg protein (BCA) |
General handling: keep collection and pre-analytical procedures consistent across study groups. For most metabolomics matrices, freeze samples promptly, store at −80 °C, avoid repeated freeze–thaw cycles, and ship frozen on sufficient dry ice. For additional collection, storage, and shipping guidance, see the Sample Submission Guideline. A minimum of three biological replicates per group is required under the general guideline; 3–6 replicates are recommended for animal samples and 6–10 for clinical samples. Study-specific sample size should reflect the design and expected variability.
For multi-omics projects, prepare a separate aliquot for each service. If the matrix is not listed or the sample is limited, contact MetwareBio before submission to confirm feasibility.
Frequently Asked Questions About Amino Acid Analysis
1. Does amino acid targeted metabolomics measure free amino acids or total amino acid content?
The standard amino acid targeted metabolomics workflow measures free and extractable amino acids and related metabolites in biological samples. It does not involve complete protein hydrolysis to release protein-bound amino acid residues. Therefore, the results reflect the concentrations of predefined extractable compounds rather than the total amino acid composition of proteins. Studies requiring total protein-bound amino acid composition need a separate hydrolysis-based analytical method.
2. What are the detection and quantification limits for amino acid analysis?
Detection and quantification limits vary among individual amino acids and related metabolites depending on their analytical response, sample matrix, and endogenous abundance. Although the calibration standards used in the demonstration method span 1–20,000 ng/mL, this range should not be interpreted as the validated detection or quantification limits of every target. For analytes requiring specific sensitivity thresholds, matrix-specific analytical feasibility and available validation data should be confirmed before the study.
3. Can the amino acid panel distinguish D- and L-amino acid isomers?
Standard amino acid targeted metabolomics using conventional achiral LC-MS/MS does not independently distinguish D- and L-enantiomers of the same amino acid. Because enantiomers have identical mass-to-charge ratios and essentially identical MS/MS fragmentation under achiral conditions, separate quantification requires dedicated chiral separation. This can be achieved using chiral stationary-phase chromatography or pre-column derivatization with chiral reagents, such as Marfey's reagent, followed by chromatographic separation of the resulting diastereomers. If enantiomer-specific quantification is required, the target compounds and analytical method should be evaluated for specialized method development.
4. Can targeted amino acid profiling measure metabolic flux?
Targeted amino acid metabolomics provides absolute concentration measurements of predefined metabolites at a specific sampling time. These measurements describe the sizes of the measured metabolite pools but do not directly quantify metabolic flux or reaction rates. Flux analysis requires additional approaches, such as stable-isotope tracer experiments with time-resolved isotopologue measurements. Targeted amino acid profiling can complement these approaches by quantifying the corresponding metabolite pools.
5. How are amino acid concentrations normalized across different sample types?
Amino acid concentrations are calculated based on analyte-specific calibration results and the original sample input, with reporting units adapted to the sample matrix. Typical units include ng/mL for liquid samples, ng/g for solid samples, ng/106 cells for cultured cells, and ng/mg protein for protein-normalized samples. Accurate sample weight, original volume, cell count, or protein concentration is therefore important for appropriate quantitative normalization and comparison.
6. Can additional amino acids or related metabolites be added beyond the 93-target panel?
The standard assay covers a predefined panel of 93 amino acids and related metabolites. Additional compounds outside this panel are not automatically included but can be evaluated for customized method development. Feasibility depends on the availability of authentic reference standards, chromatographic behavior, mass spectrometric response, sample matrix, and required quantitative performance. Researchers can provide their target compound list and study requirements for technical evaluation.
7. Can amino acid concentrations be directly compared across different species and sample matrices?
Absolute quantification provides concentration-based measurements, but results from different species or sample matrices are not necessarily directly comparable. Biological differences, matrix effects, extraction recovery, and sample normalization can all influence measured concentrations. Comparisons are most straightforward when samples share the same matrix and standardized collection and processing procedures. Cross-matrix or cross-species comparisons require appropriate experimental design and careful biological interpretation.
8. Can amino acid analysis be performed with limited sample amounts or uncommon biological matrices?
Sample feasibility depends on the target analytes, matrix composition, available sample amount, and expected endogenous concentrations. Recommended and minimum input requirements vary considerably among tissues, biological fluids, cells, feces, and microbial samples. For sample types not covered by the standard requirements, or when available material is below the recommended minimum, MetwareBio's technical team can evaluate the project before submission to determine whether the assay is suitable.
Reference
Lin, K., Wei, L., Wang, R., Li, L., Song, S., Wang, F., He, M., Pu, W., Wang, J., Wazir, J., Cao, W., Yang, X., Treuter, E., Fan, R., Wang, Y., Huang, Z., & Wang, H. (2025). Disrupted methionine cycle triggers muscle atrophy in cancer cachexia through epigenetic regulation of REDD1. Cell Metabolism, 37(2), 460–476.e8. https://doi.org/10.1016/j.cmet.2024.10.017