
Metagenomic Sequencing
Technology Introduction
Metagenomic sequencing can reveal the diversity of microorganisms in various microenvironments, provide in-depth understanding of community biological functions, and analyze the relationship between microbial communities and host phenotypes. With the rapid development of sequencing technology and informatics, metagenomic research based on Next-Generation Sequencing (NGS) has become a fundamental strategy for studying community diversity and characteristics.
Applications of Metagenomic Sequencing
-
In the medical field
Biomarker screening
Functional research
Mechanistic research
-
In the plant field
Research on leaf-associated microbial interactions
Research on root-associated microbial interactions
Bioinformation Analysis Display of Metagenomic Sequencing
LEfSe analysis
LEfSe analysis of inter-group differential species can be used to identify biomarkers with significant differences between groups. This method employs the Kruskal-Wallis test to detect different species between various groups and uses Linear Discriminant Analysis (LDA) to reduce dimensionality and assess the impact size of differential species, resulting in LDA scores. The LEfSe analysis results for inter-group differential species include two components: a bar plot of LDA values distribution and a cladogram (phylogenetic distribution).

Functional annotation analysis
Functional annotation analysis is conducted using databases such as KEGG, eggNOG, and CAZy. Gene count tables for each sample at various taxonomic levels are obtained, and starting from the abundance tables at different taxonomic levels, comparative analyses of metabolic pathways and inter-group functional differences can be performed.

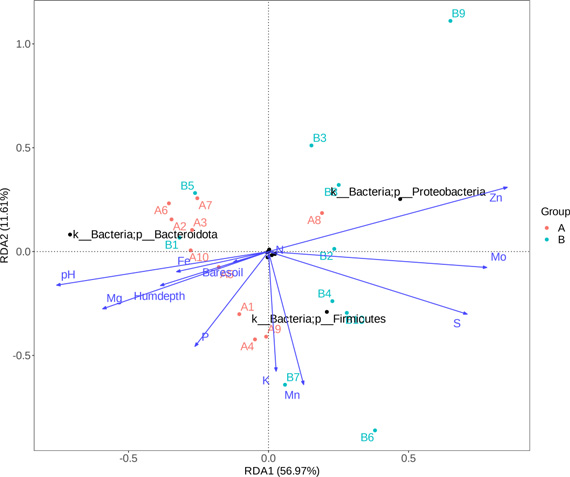
Environmental factor correlation analysis
Environmental factor correlation analysis provides combinations of multiple environmental factors and calculates correlation values between each group of environmental factors and the microbial community. Based on these correlation values, a combination with the highest correlation to the microbial community is selected, representing the environmental factors with the greatest impact on the microbial community.
CCA/RDA analysis, an extension of correspondence analysis, combines correspondence analysis with multiple regression analysis. It calculates regression at each step with environmental factors, also known as multivariate direct gradient analysis. CCA is based on a unimodal model, while RDA is based on a linear model. CCA/RDA analysis is mainly used to reflect the relationship between microbial communities and environmental factors, detecting relationships between environmental factors, samples, and microbial communities, and identifying important environmental driving factors affecting sample distribution.
Random Forest Analysis
Random Forest belongs to the ensemble type of machine learning algorithms. In machine learning logistic regression modeling, data is divided into training and testing sets, with the testing set containing at least 30 samples, preferably occupying 1/3 to 1/5 of the data. It is recommended to have more than 90 samples for this analysis. The best model selected through the Random Forest method is used to plot the ROC curve, and the Area Under Curve (AUC) between the ROC curve and the x-axis is a quantitative evaluation metric. A higher AUC value, approaching 1, indicates a better predictive performance of the model.


Sample Requirements of Metagenomic Sequencing
|
Sample Type |
Amount |
Volume |
Concentration |
Purity |
|
Total DNA |
≥ 200 ng |
≥ 20 μL |
≥ 10 ng/μL |
A260/280 = 1.8-2.0 |
