
Advanced Techniques in Metabolomics Data Processing
The field of metabolomics has rapidly evolved into a cornerstone of modern biological research, providing a comprehensive view of the small molecules within cells that are the end products of various metabolic processes. In today's discourse, we're excited to delve into the methodologies underpinning metabolomics data processing, a crucial aspect for researchers aiming to extract meaningful insights from complex datasets, It covers:
- Data Format Standards and Conversion Techniques in Metabolomics
- Data Preprocessing
- Data Analysis: Normalization, Standardization, and Centering/Zero-Mean
1. Data Format Standards and Conversion Techniques in Metabolomics
Data Format Conversion For different instrument manufacturers, the final output file formats vary. The specific data types are as follows.Although open-source software is widely used in metabolomics research, to utilize these free and open-source software for processing MS data, the original data obtained must be converted into appropriate formats, such as mzXML, mzML, mzData, and netCDF. ProteoWizard can convert various proprietary formats into open formats including mzML 1.1, mzML 1.0, mzXML, MGF, MS2/CMS2/BMS2, and mzIdentML, with mzXML and mzML being the standard data formats.
Table 1. Instrument Data Types by Manufacturer
|
Manufacturer |
Format |
Manufacturer |
Format |
|
AB SCIEX |
WIFF; T2D (with DataExplorer) |
HUPO PSI |
mzML |
|
Agilent |
MassHunter (.d directories) |
ISB Seattle Proteome Center |
mzXML |
|
Bruker |
FID; .d directories; XMASS XML |
Matrix Science |
MGF |
|
Thermo |
RAW |
Yates/MacCoss Laboratories |
MS2/CMS2/BMS2 |
|
Waters |
Raw directories |
Steen & Steen Laboratory |
mz5 |
2. Data Preprocessing
Data preprocessing is a critical initial step in the analytical pipeline of metabolomics studies. This phase involves a suite of techniques aimed at preparing raw data for subsequent analysis, ensuring that the information derived is accurate and reliable. In the context of metabolomics, preprocessing may include noise reduction, baseline correction, peak alignment, and normalization, among other procedures. These methods are essential for transforming complex datasets into a format that can be effectively analyzed to yield biologically meaningful insights.For specific details on the first few steps, you can refer to "Plant Metabolomics - Methods and Applications."
In result organization, one of the most important aspects is normalization. Early normalization methods often referred to the proportion of metabolite integral values within a unit segment interval to the total effective signal of the spectrum. This normalization method is primarily used to eliminate moderate concentration differences between different samples, such as in the urine samples of conventional animal models, which can eliminate differences in urine concentration caused by factors such as drinking water in different animals. However, this normalization method is not suitable when the content of a certain metabolite in the sample changes significantly. The second method uses the ratio of the unit segment integral value to the peak area of a relatively invariant metabolite as the normalization variable. For plant metabolomics, the best method is to normalize based on the dry weight before plant extraction, which is why the first step in plant metabolomics experiments is to freeze-dry the samples at low temperatures to ensure that the metabolites can be compared at the same level after the removal of moisture from the samples.
3. Data Analysis: Normalization, Standardization, and Centering/Zero-Mean
Transformation In addition to considering normalization on the same level for metabolites to avoid the impact of moisture content during preprocessing, it is also necessary to normalize the preprocessed analysis data when performing multivariate analysis. This normalization is mainly for:
- reducing the magnitude of data to make different properties of variables comparable;
- transforming different orders of magnitude of variable data through different conversions to a suitable range to prevent large-value variables from overshadowing the fluctuations of small-value variables.
There is currently no clear regulation in the industry regarding the attribution of normalization, standardization, and centering. Therefore, for the sake of understanding, we can simply remember them based on their different operational rules.
3.1 Normalization/Min-Max Scaling
There are three main types:
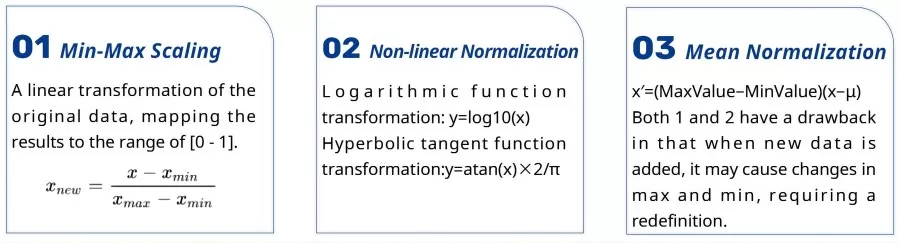
(1) Min-Max Scaling
Due to the significant differences in metabolite content, it is necessary to process the data. Metabolite content data is normalized using the range method, and then cluster heat map analysis is performed on all samples.This is a linear transformation of the original data, mapping the results to the range of [0 - 1].

If the range is within the interval [a, b], the calculation formula is: Ynew=a+(b−a)×(Max−Min)(Y−Min)
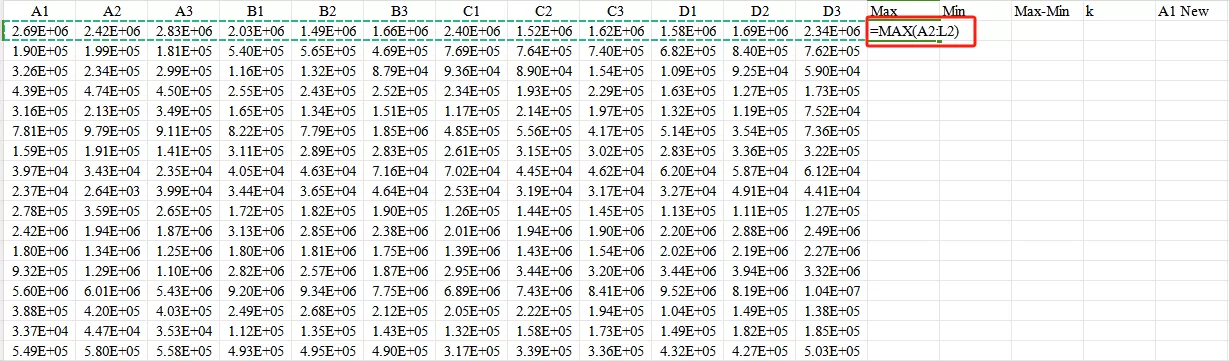
For example, to normalize data to the range [-3, 3] using Excel, the Excel formulas used are: Max, Min. The specific operation is as follows:
First,use the Max and Min functions in Excel to obtain the maximum and minimum values of the data row.
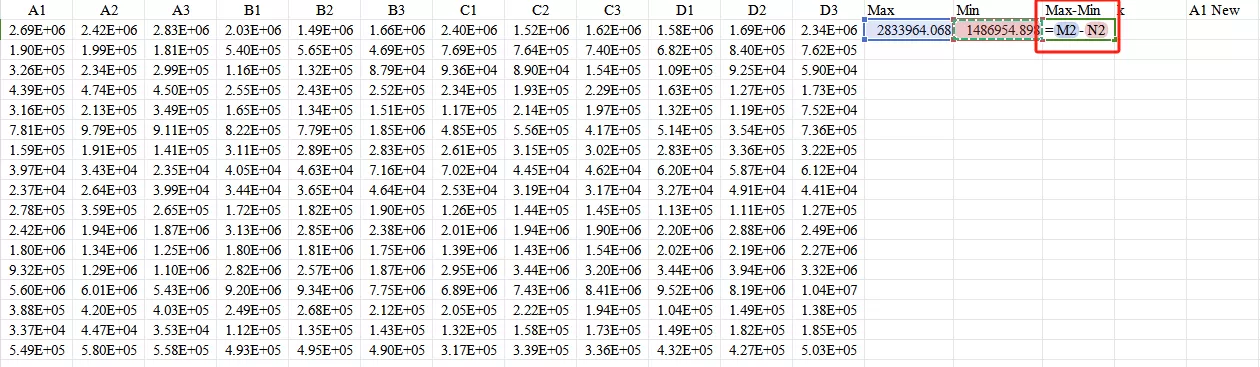
Second,calculate the value of Max - Min.
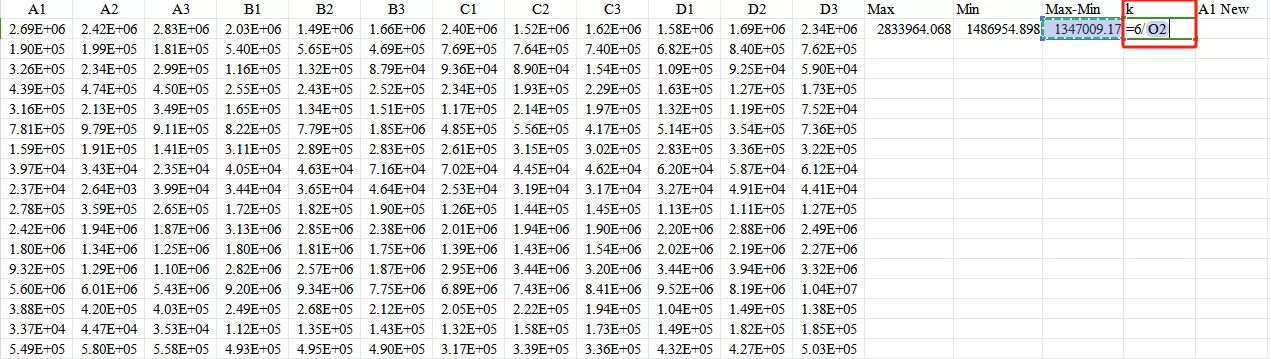
Third,calculate the k value: for example, if the output range is [-3, 3], then k = [3 - (-3)] / (Max - Min).
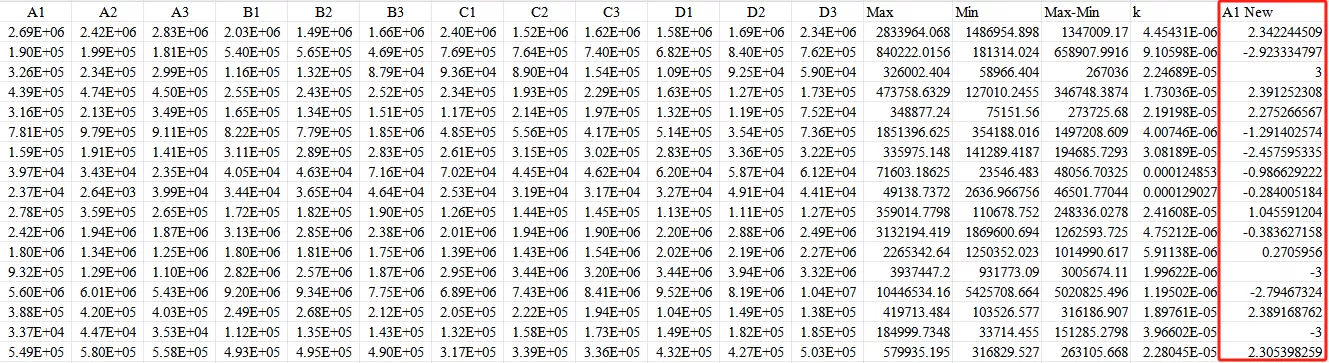
Finally, use the formula Ynew=−3+k×(Y−Min) to obtain the normalized value.
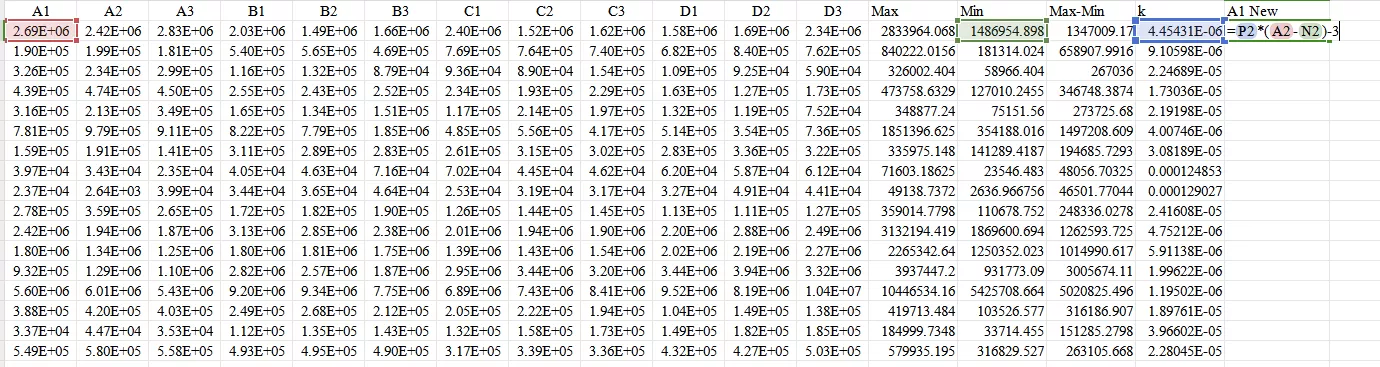
Ultimately, obtain all normalized values.
Different legends (values next to the cluster heat map) result in different graphical outputs:
_1716369307_WNo_800d371.webp)
(2) Non-linear Normalization
This method is often used in scenarios where data differentiation is significant, with some values being very large and others very small. Mathematical functions are used to map the original values. This method includes logarithms, exponents, and tangents, etc. The specific curve of the nonlinear function should be determined based on the data distribution, such as log(V, 2) or log(V, 10), etc.
3.2 Standardization
Standardization processes data according to the columns of the feature matrix. There are various methods of data standardization, such as linear methods (e.g., range method, standard deviation method), piecewise linear methods (e.g., three-piece linear method), and curve methods (e.g., half-normal distribution). Different standardization methods can have different impacts on system evaluation results. The most commonly used is the Z-Score standardization.
(1)UV (unit variance scaling)/Z-score
Z-Score Standardization,This method standardizes the original data based on the mean and standard deviation of the sample data. The processed data conforms to the standard normal distribution, with a mean of 0 and a standard deviation of 1. The transformation function is:
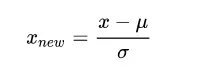
Where μ is the mean of the sample data, and σ is the standard deviation of the sample data. In addition, the standardized data retains the useful information in the outliers, making the algorithm less sensitive to outliers, which normalization cannot guarantee.The advantage of UV is that all variables have equal importance, but the disadvantage is that detection errors may be amplified.
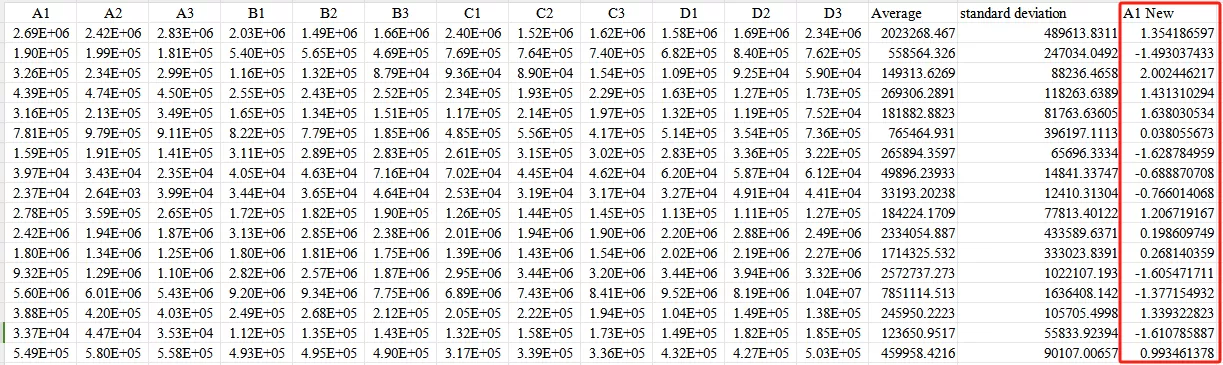
Moving forward, we'll explore the process of conducting Z-score transformations utilizing Microsoft Excel.The formulas used in Excel are: AVERAGE, STDEV.The calculation process is as follows:
First,Calculate the mean.
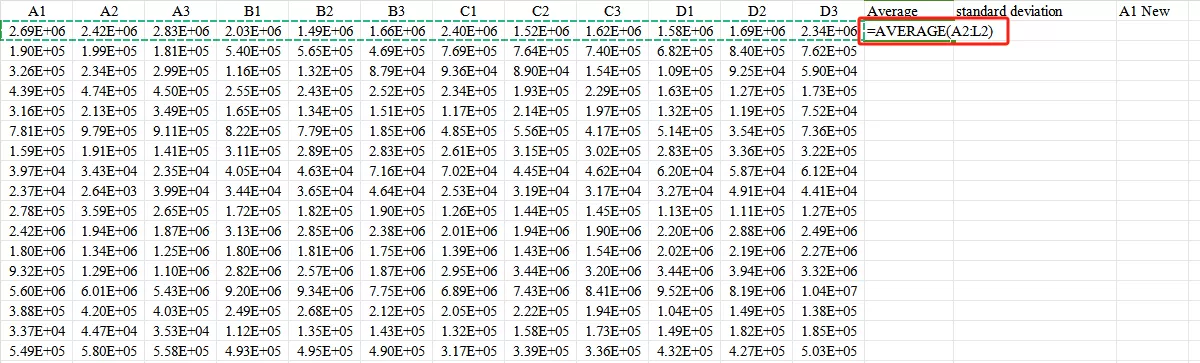
Second,Calculate the standard deviation.
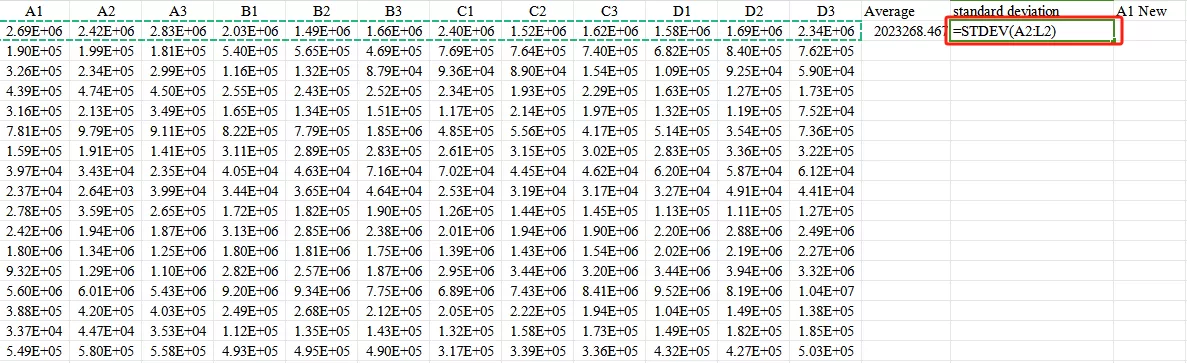
Third,Input the formula Xnew=(X−mean)/standard deviation
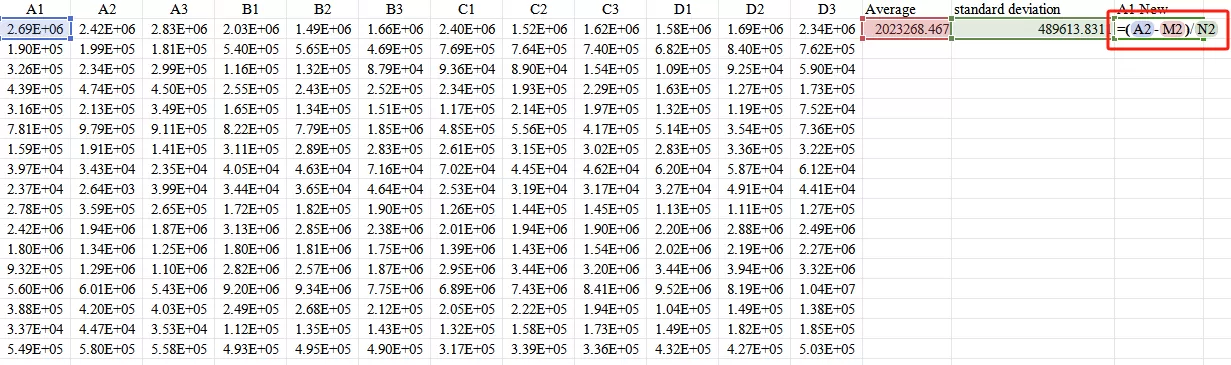
Ultimately, obtain the standardized values.
(2)Pareto Scaling
Pareto scaling is the arithmetic square root of the division of the data centered by subtracting the mean from the column variable standard deviation.
UV and Pareto are common standardization methods. Based on different standardization methods, subsequent data analysis will select different methods for screening differential metabolites, such as the V-plot (Figure 1-A) under UV, and the S-plot (Figure 1-B) under Pareto. No matter which standardization method is chosen, it is necessary to strictly verify the established model to ensure the selection of reliable differential metabolites. Since the VIP value is often one of the criteria for differential variable screening, the V-plot can more objectively select variables.
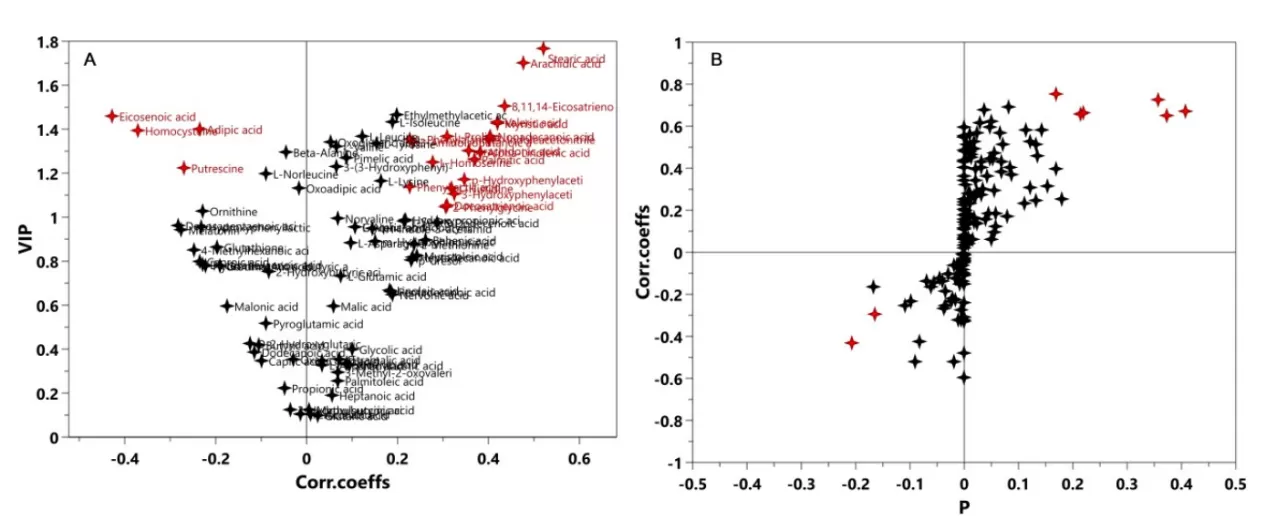
Figure 1. V-plot (left) and S-plot (right)
3.3 Center scaling/Zero-Mean
Ctr Calculation method: Original data minus the mean of each column variable.
Ctr transforms the original data into new data closer to the origin, which can adjust the differences in high and low concentrations of metabolites.
3.4 Differences and Similarities Between Normalization and Standardization
(1) Differences
Normalization converts the feature values of samples to the same dimension, mapping the data to the interval [0,1] or [-1, 1], determined only by the extreme values. Interval scaling is a type of normalization.
Standardization processes data according to the columns of the feature matrix. It transforms the data into a standard normal distribution through the calculation of the z-score, related to the overall sample distribution, where each sample point can affect the standardization.
(2) Similarities
Their common point is that they can cancel out errors caused by different dimensions, both are linear transformations, and both compress the vector X proportionally and then translate it.
3.5 Applicable Scenarios for Normalization and Standardization
(1) If the data distribution itself follows a normal distribution, use Z-Score.
(2) In the case of outliers: use Z-Score. This does not mean that Z-Score is unaffected by outliers, but rather, Min-Max is very sensitive to outliers because their appearance will affect the max or min values in the data, making the effect of Min-Max very poor. In comparison, although the calculation of variance and mean when using Z-Score is still affected by outliers, the impact is smaller than that of the Min-Max method.
(3) If there is a requirement for the output result range, use normalization.
(4) If the data is relatively stable and there are no extreme maximum and minimum values, use normalization.
(5) If there are outliers and a lot of noise in the data, use standardization, which can indirectly avoid the impact of outliers and extreme values through centering.
Read More:
Next-Generation Omics Solutions:
Proteomics & Metabolomics
Ready to get started? Submit your inquiry or contact us at support-global@metwarebio.com.
