
Missing Value Imputation in Quantitative Proteomics: Methods, Evaluation, and Tools
1. Understanding Missing Values in Mass Spectrometry-Based Proteomics
Quantitative proteomics based on mass spectrometry (MS) has become a cornerstone of modern biological and clinical research, enabling large-scale protein identification and quantification. However, one persistent challenge in proteomic data analysis is the occurrence of missing values, which can significantly affect data quality and downstream biological interpretation. These missing entries are generally classified into three categories: Missing Completely at Random (MCAR), Missing at Random (MAR), and Missing Not at Random (MNAR).
MCAR typically arises from random fluctuations or unstable performance of the mass spectrometer, showing no systematic bias and being evenly distributed across the dataset. MAR, on the other hand, depends on other measurable factors; for example, longer chromatographic gradients are often associated with higher rates of missing values. MNAR is particularly critical in quantitative proteomics, as it is linked to analyte abundance: when peptide or protein concentrations fall below the detection limit of the instrument, their quantitative signals are lost. This phenomenon, also known as left-censored data, is considered the predominant source of missingness in proteomic datasets. In practice, missing values usually result from a combination of MAR and MNAR, with low-abundance proteins contributing most to the problem.

Examples of missing values in proteomic dataset
Because many downstream analyses—such as hypothesis testing, principal component analysis (PCA), and hierarchical clustering—require a complete and consistent data matrix, missing values can severely compromise statistical robustness and biological insight. As a result, data preprocessing through filtering and imputation has become a crucial step in mass spectrometry-based proteomics workflows, improving both proteome coverage and the statistical power of subsequent analyses.
2. Strategies and Methods for Missing Value Imputation in Proteomic Data
If the dataset is large and the proportion of missing values is relatively small, one may assume that removing entries with missing values will not significantly affect the results. However, when the missing rate is higher, imputation methods become necessary. Below are six commonly applied approaches; the choice of method primarily depends on dataset characteristics.
(1) Mean Imputation
- Background: Appropriate when missing values are few (<5–10%) and the mechanism approximates MCAR.
- Principle: Missing entries are replaced with the arithmetic mean of the observed values for that feature.
- Advantages: Simple to implement with low computational cost; preserves the overall feature mean.
- Disadvantages: Underestimates variance and attenuates correlations, potentially biasing multivariate analyses.
(2) K-Nearest Neighbors Imputation (KNN)
- Background: Suitable for MCAR or MAR data, moderate missingness (≤30%), and when correlations exist among variables. Applicable to both numerical and categorical data.
- Principle: For each incomplete sample, identify K most similar neighbors with complete data and impute using their mean (numerical) or mode (categorical).
- Advantages: Maintains data structure and correlations; non-parametric and assumption-free; supports diverse data types.
- Disadvantages: Computationally intensive for large datasets; sensitive to outliers; less effective when many values are missing.
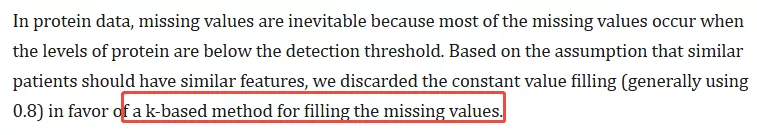
- Example: In a 2024 study on AI-driven eyelid tumor classification using proteomic data, KNN imputation was successfully applied (doi: 10.1038/s41698-024-00767-8).
(3) Quantile Regression Imputation of Left-Censored Data (QRILC)
- Background: Designed for left-censored data where values below detection limits are reported as “not detected.”
- Principle: Builds a quantile regression model on observed data to estimate plausible quantiles for missing values.
- Advantages: Does not rely on normality assumptions and better preserves tail distributions.
- Disadvantages: Requires careful quantile selection and relatively large sample sizes; model construction is complex.
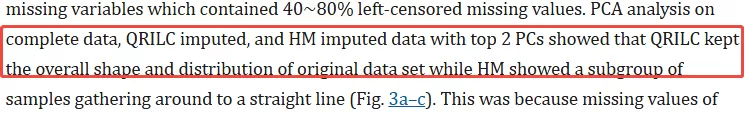
- Example: A 2018 study on metabolomics demonstrated that QRILC effectively preserved dataset distribution (doi: 10.1038/s41598-017-19120-0).
(4) Local Least Squares Imputation (LLS)
- Background: Effective for high-dimensional data (e.g., gene expression, proteomics) where missing values cluster and strong local linear relationships exist.
- Principle: Combines KNN with regression. Selects K nearest neighbors, constructs a local linear regression model, and predicts missing values accordingly.
- Advantages: Balances local similarity with predictive strength; generally outperforms mean or KNN imputation in high-dimensional settings.
- Disadvantages: Computationally complex; sensitive to noise and outliers.
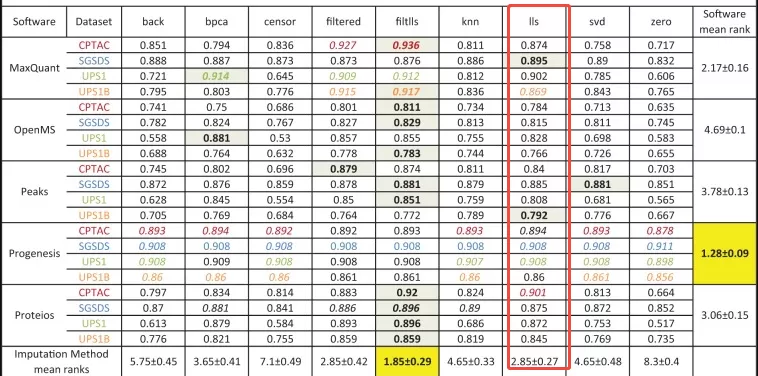
- Example: A 2017 evaluation of label-free proteomics workflows ranked LLS second in overall imputation performance (doi: 10.1093/bib/bbx054).
(5) Probabilistic Minimum Imputation (MinProb)
- Background: Commonly used in environmental or QC data where low values are reported as “not detected.”
- Principle: Estimates the data distribution, predicts minimal plausible values via probabilistic modeling, and imputes through random sampling.
- Advantages: Reflects uncertainty realistically, preserves extreme values, and avoids uniform substitution.
- Disadvantages: Relies on distributional assumptions; risk of bias if assumptions fail; requires sampling.
- Example: A 2023 MultiPro study showed MinProb performed well in tested datasets (doi: 10.1038/s41597-023-02779-8).
(6) Median Imputation
- Background: Suitable for skewed data under MCAR, particularly when robustness to outliers is desired.
- Principle: Replaces missing entries with the median of observed values for that feature.
- Advantages: Robust to outliers and simple to implement; well-suited for skewed distributions.
- Disadvantages: Similar to mean imputation, it underestimates variance and weakens correlations; ignores uncertainty.
- Example: In the 2023 MultiPro study, median imputation underperformed at low missing rates but improved with higher levels of missingness (doi: 10.1038/s41597-023-02779-8).

3. Performance Evaluation Metrics for Proteomics Imputation Approaches
(1) NRMSE (Normalized Root Mean Square Error)
- Principle: NRMSE quantifies the deviation between imputed and true values by calculating the root mean square error, normalized by the standard deviation of the true values to eliminate scale effects.

- Application: A smaller NRMSE indicates that the imputed values are closer to the true values, which is particularly suitable for assessing imputation under MCAR conditions. We applied this metric to our experimental data, and the evaluation results are illustrated in the figure below.

(2) PCC (Pearson Correlation Coefficient)
- Principle: PCC measures the linear correlation between imputed and true values, reflecting whether the overall variation trends are preserved.

- Application: A PCC value close to 1 indicates strong consistency between imputed and true datasets. We calculated PCC using our own experimental data to evaluate whether correlations were well preserved after imputation, with results shown in the figure below.

(3) Data Distribution Comparison
- Principle: This method examines distributional changes before and after imputation, often by comparing standardized Z-scores. Maintaining the original skewness is particularly important for left-censored data.

- Application: If the distribution remains stable after imputation (i.e., Z-score shifts are minimal), it suggests that the imputation method introduces little bias. We assessed distributional stability in our experimental dataset, and the results are presented in the following figure.

(4) PCA/Cluster Structure Stability
- Principle: Principal component analysis (PCA) or t-SNE can be used to determine whether the overall clustering of samples remains consistent after imputation. If unreasonable structural changes appear, it suggests artifacts introduced by imputation. To quantify this, we evaluated several metrics: the change in explained variance (ΔEV), loading angle differences (load_θ), sample displacement (Disp), and change in reconstruction error (ΔMSE). These metrics were integrated into a composite PCA score.
- Application: A smaller PCA score indicates minimal structural differences between pre- and post-imputation data. We performed this evaluation on our experimental dataset, and the results are shown in the figure below.

4. Online Tools for Assessing Missing Value Imputation in Proteomics
Quantitative proteomics involves complex imputation strategies, and performance varies across datasets depending on missingness type and rate. No single method is universally optimal.
NAguideR is a recommended online tool that integrates 23 commonly used imputation methods. It allows users to upload their datasets, automatically evaluates all methods, and assists in selecting the most appropriate strategy.

5. Future Perspectives on Missing Value Imputation in Proteomics
In mass spectrometry-based quantitative proteomics, missing values remain an inevitable challenge despite significant advances in instrumentation and analytical workflows. Although their occurrence has been substantially reduced, effective handling of missing data continues to be essential for ensuring accurate biological interpretation. Among the commonly applied strategies, the combination of data filtering and K-nearest neighbors (KNN) imputation has emerged as one of the most practical and widely adopted approaches. Nevertheless, no single method can be universally optimal. A thorough understanding of the strengths and limitations of each imputation technique, together with systematic performance evaluation, is crucial for selecting the most appropriate strategy. By implementing well-designed missing value imputation workflows, researchers can enhance data completeness, improve statistical power, and ultimately achieve more reliable and reproducible insights in proteomics studies.
Reference
1. Wang L, Dai X, Liu Z, Zhao Y, Sun Y, Mao B, Wu S, Zhu T, Huang F, Maimaiti N, Cai X, Li SZ, Sheng J, Guo T, Ye J. AI-driven eyelid tumor classification in ocular oncology using proteomic data. NPJ Precis Oncol. 2024 Dec 23;8(1):289. doi: 10.1038/s41698-024-00767-8. PMID: 39715816; PMCID: PMC11666576.
2. Wei R, Wang J, Su M, Jia E, Chen S, Chen T, Ni Y. Missing Value Imputation Approach for Mass Spectrometry-based Metabolomics Data. Sci Rep. 2018 Jan 12;8(1):663. doi: 10.1038/s41598-017-19120-0. PMID: 29330539; PMCID: PMC5766532.
3. Välikangas T, Suomi T, Elo LL. A comprehensive evaluation of popular proteomics software workflows for label-free proteome quantification and imputation. Brief Bioinform. 2018 Nov 27;19(6):1344-1355. doi: 10.1093/bib/bbx054. PMID: 28575146; PMCID: PMC6291797.
4. Wang H, Lim KP, Kong W, Gao H, Wong BJH, Phua SX, Guo T, Goh WWB. MultiPro: DDA-PASEF and diaPASEF acquired cell line proteomic datasets with deliberate batch effects. Sci Data. 2023 Dec 2;10(1):858. doi: 10.1038/s41597-023-02779-8. PMID: 38042886; PMCID: PMC10693559.
5. Wang S, Li W, Hu L, Cheng J, Yang H, Liu Y. NAguideR: performing and prioritizing missing value imputations for consistent bottom-up proteomic analyses. Nucleic Acids Res. 2020 Aug 20;48(14):e83. doi: 10.1093/nar/gkaa498. PMID: 32526036; PMCID: PMC7641313.
Read more
- DIA Proteomics vs DDA Proteomics: A Comprehensive Comparison
- Multi-Omics Association Analysis Series
- Omics Data Processing Series
- Omics Data Analysis Series
- Metabolomics Batch Effects
- Understanding WGCNA Analysis in Publications
- Metabolomic Analyses: Comparison of PCA, PLS-DA and OPLS-DA
- WGCNA Explained: Everything You Need to Know
- Beginner for KEGG Pathway Analysis: The Complete Guide
- GSEA Enrichment Analysis: A Quick Guide to Understanding and Applying Gene Set Enrichment Analysis
- Comparative Analysis of Venn Diagrams and UpSetR in Omics Data Visualization
Next-Generation Omics Solutions:
Proteomics & Metabolomics
Ready to get started? Submit your inquiry or contact us at support-global@metwarebio.com.
