
Unlocking Plant Development: A Metabolic Map from Seed to Maturity with Spatial Metabolomics
Plant growth is not a uniform chemical process. Germination begins in discrete embryo regions, roots partition metabolism across developmental zones, and fruits build quality traits in tissue‑specific pockets. Conventional metabolomics usually requires homogenization, which collapses these spatial programs into a single average signal. Spatial metabolomics—most commonly enabled by mass spectrometry imaging (MSI)—keeps metabolites in place and visualizes their distributions, helping researchers connect “what changes” to “where it changes” across development.
1. Why We Need a Spatial Lens for Plant Growth
Plant development couples changing spatial structures with metabolite transport and local signaling. Bulk metabolomics is excellent for coverage and statistics, but it struggles with questions like where a metabolite is produced, where it accumulates, and which tissues communicate through chemical gradients. Spatial metabolomics complements bulk profiling by revealing the metabolic architecture of tissues at cellular or near‑cellular resolution, turning development into an interpretable map rather than a blended average.
1.1 Tissue and Cellular Heterogeneity: When Averages “Lie”
Plant organs are metabolic mosaics, and homogenization can erase contrasts that drive function. In germinating mung bean, MALDI‑MSI showed that storage triglycerides decline mainly in the cotyledon while sphingolipids rise in the plumule, implying a spatial handoff from reserve mobilization to membrane remodeling in the emerging shoot [1]. Tomato fruit imaging likewise showed that some metabolites are broadly distributed while others are restricted to specific tissues; for example, flavonoids such as naringenin can be concentrated in seed‑associated regions rather than uniformly across the pericarp [2]. These patterns are not cosmetic: they distinguish synthesis sites from utilization sites and help explain why a metabolite changes during development—because a specific tissue is turning a pathway on or off.
1.2 Source–Sink Dynamics and Transport: Where Metabolites Are Made vs. Where They Accumulate
Development is powered by allocation. Sources (photosynthetic leaves, reserve tissues) export carbon and nitrogen, while sinks (meristems, roots, fruits, seeds) import and convert them. Spatial metabolomics makes these routes visible. In rice seeds at the dough stage, MALDI‑MSI resolved amino‑acid enrichment in embryo regions alongside sugar enrichment in endosperm, providing direct evidence for tissue‑specific provisioning of the developing plant [3]. In tomato, spatial shifts of organic acids and other flavor‑relevant metabolites across tissues help explain how sensory traits emerge during ripening [2]. Seeing “where” is crucial because transport can mimic biosynthesis in bulk data; MSI helps disentangle whether a metabolite increases because it is produced locally or because it is delivered and stored.
1.3 Hormonal Gradients and Local Signaling: Developmental Control Often Happens in Micron‑Scale Niches
Key developmental decisions often depend on localized signals rather than organ‑wide concentrations. Spatial mapping during germination illustrates this principle: in maize seeds, phospholipids show fatty‑acyl‑dependent localization within the radicle, and ceramides concentrate near the endosperm–scutellum interface, consistent with localized membrane remodeling and boundary‑specific signaling during nutrient exchange [4]. Even when classical hormones are difficult to quantify by imaging alone, these spatial lipid patterns reveal where signaling and rapid growth are most active, guiding targeted follow‑up with bulk or targeted assays.
1.4 Bridging Phenotype and Mechanism: Aligning Morphology and Metabolism on the Same Section
Spatial metabolomics becomes especially powerful when metabolite maps are aligned with anatomy. In Tartary buckwheat achene development, combined LC‑MS and MALDI‑MSI showed flavonols accumulating in the seed coat during late maturation, coinciding with structural reinforcement and tissue differentiation [5]. In tomato, MSI across maturity stages connected redistribution of key acids and specialized metabolites to visible changes in color and tissue status. This co‑registration turns descriptive metabolite lists into mechanistic explanations: the tissue that changes first is often the tissue where the pathway turns first.
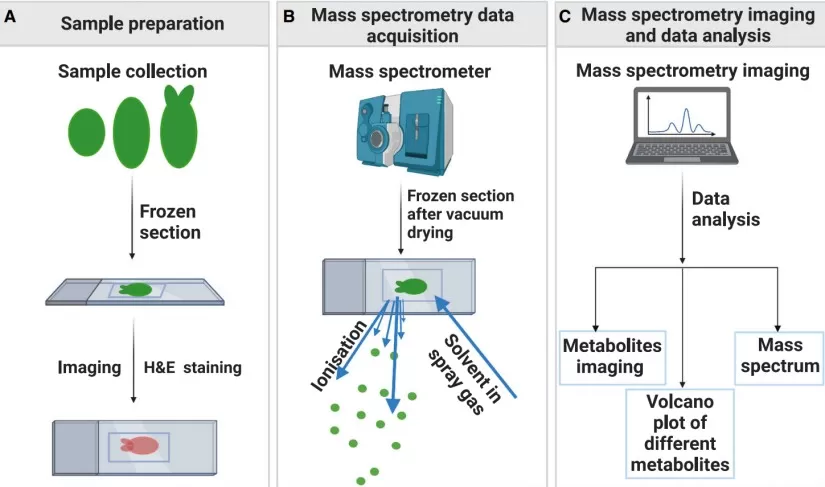
Spatial metabolomics analysis of plant samples
Image reproduced from Yu et al., 2023, Plant Commun, licensed under the Creative Commons Attribution 4.0 International License (CC BY 4.0).
2. Spatiotemporal Metabolic Atlas: From Seed to Senescence
Across the lifecycle, the same workflow applies: define informative tissue regions, focus on metabolite classes tied to the biological question, and sample in ways that preserve spatial contrasts. The examples below illustrate how spatial metabolomics clarifies stage‑specific programs and pinpoints where to validate findings with extraction‑based profiling.
Stage 1: Seed Germination—Spatial Fueling of Growth Hotspots
Seed germination is an ideal entry point for spatial metabolomics because reserve tissues and embryonic growth zones are anatomically distinct. In mung bean, MALDI‑MSI revealed triglyceride depletion concentrated in cotyledons, while sphingolipids increased in the plumule, consistent with reserve mobilization supporting rapid membrane biogenesis as the shoot emerges [1]. This localization helps answer practical questions—such as whether delayed germination reflects poor reserve mobilization or impaired embryo activation—because the affected region is visible. For sampling, longitudinal sections that capture cotyledon, plumule, and radicle are most informative, and short time courses around imbibition and radicle emergence allow you to map the sequence of metabolic activation rather than a single snapshot [4].

Lipid changes in mung bean seeds during germination
Image reproduced from Xie et al., 2023, J Agric Food Chem, licensed under the Creative Commons Attribution 4.0 International License (CC BY 4.0).
Stage 2: Root Development and Seedling Establishment—Zone‑Specific Labor Underground
Roots are developmentally zoned (meristem, elongation, maturation), and their chemistry tracks that division of labor. Reviews of plant spatial metabolomics highlight roots as prime targets for mapping organic acids, phenolics, and other metabolites tied to nutrient acquisition and root–environment interactions [6,7]. In practice, MSI can reveal whether a compound associated with uptake is enriched at the epidermis and root hair zone, whether a signaling lipid peaks near the meristem, or whether defense metabolites concentrate around the stele where transport is protected. A workable design is to section roots at defined distances from the tip (to represent zones) and to pair MSI with targeted LC‑MS on micro‑dissected regions for quantitation and pathway interpretation [6].
Stage 3: Vegetative Growth—Leaf Zonation for Transport, Photosynthesis, and Defense
During vegetative growth, leaves act as both factories and logistics hubs. Spatial metabolomics is useful because vasculature, mesophyll, and epidermis play distinct roles that bulk assays merge. In Cyclocarya paliurus, spatial metabolome mapping showed that phenolic compounds can be enriched in outer leaf layers, consistent with roles in UV protection and defense, while other metabolites follow patterns aligned with internal tissues [8]. Such maps help interpret why a stress response appears “weak” in homogenized samples—because it may be strong but restricted to a thin epidermal layer. For sampling, cross‑sections support layer‑specific interpretation, while flat sections across veins can illuminate transport‑linked distributions [6,8].
Stage 4: Reproduction and Fruit Maturation—Tissue‑Specific Programs that Build Quality
Reproductive development intensifies metabolic specialization: flowers and fruits invest in pigments, acids, and secondary metabolites in a tissue‑dependent manner. Tomato provides a representative MSI case study in which metabolite distributions were tracked across maturity stages, revealing that some compound classes are widespread whereas others are restricted to particular tissues, including seed‑associated compartments [2]. This matters because flavor and nutritional traits are often governed by localized accumulation rather than whole‑fruit averages; an acid or flavonoid may drive taste or health value even if it is concentrated in a narrow region. Practically, cross‑sections that include pericarp, locular tissues, and seeds, sampled at defined ripening stages, provide a clear spatiotemporal readout of how quality traits are built.

Phosphatidylcholine molecular species from a developing camelina embryo
Image reproduced from Horn et al., 2024, J Exp Bot, licensed under the Creative Commons Attribution 4.0 International License (CC BY 4.0).
Stage 5: Senescence—Spatially Directed Nutrient Recycling
Senescence is an active, regulated recycling program that reallocates nutrients from aging tissues to sinks. Methodological advances in plant MSI emphasize its ability to follow broad metabolite classes during such transitions, including nitrogen‑rich compounds and stress‑related metabolites [9]. Spatial omics frameworks for crop improvement further stress that understanding where remobilization happens can inform breeding for yield and resilience, because grain filling and senescence are tightly coupled by source–sink balance [10]. In practice, imaging leaves along a tip‑to‑base axis (or vein vs. lamina) across senescence time points can reveal gradients of nutrient export and defense chemistry, while paired bulk assays on dissected regions validate magnitude and pathway drivers [9,10].
3. Methodology and Experimental Design
3.1 Why MALDI‑MSI Is Widely Used
MALDI‑MSI is widely adopted in plant spatial metabolomics because it can profile diverse metabolite classes directly from fresh‑frozen sections with practical spatial resolution and sensitivity [6,9]. Compared with purely extraction‑based workflows, MALDI‑MSI preserves tissue context and allows discovery‑driven localization. A common strategy is to use MSI to identify “hotspots” and then validate and quantify with targeted assays on adjacent or micro‑dissected tissue, combining spatial insight with robust quantitation [6].
3.2 Resolution Selection (Decision Table)
|
Biological question |
Suggested pixel size |
Typical use case |
|
Organ/tissue gradients |
50–200 μm |
Fruit maturity gradients and large-scale distribution patterns [2] |
|
Cell-type localization |
5–20 μm |
Embryo vs. endosperm or tissue-layer differences [3] |
|
Subcellular features |
<5 μm |
Fine lipid compartmentation in oil-rich tissues [11] |
3.3 Controls and Replication
Because MSI results are visually intuitive, it is easy to over‑interpret single images. Robust designs therefore include background controls (matrix‑only/off‑tissue), careful standardization of matrix application and acquisition, and biological replication to separate biology from technical variation [9]. Serial sections are particularly valuable: one for MSI and an adjacent one for histology, ensuring that metabolite features are assigned to the correct tissue structures. Where possible, region‑specific extraction (micro‑dissection or guided sampling) should be used to confirm key MSI findings and to support statistical comparisons across genotypes, environments, or developmental time points [6,9].

Overview of plant MSI workflow
Image reproduced from Horn et al., 2024, J Exp Bot, licensed under the Creative Commons Attribution 4.0 International License (CC BY 4.0).
4. Conclusion: From Average Profiles to Lifecycle Metabolic Maps
Understanding plant development ultimately requires understanding metabolism in space and time. Spatial metabolomics enables this by mapping where reserve mobilization, transport, signaling, and tissue‑specific specialization occur, from germination through fruit maturation and into senescence [1–3,9]. It is therefore not only a technical upgrade but a shift in research paradigm: development becomes interpretable as a sequence of spatially organized metabolic programs that can inform crop research and improvement strategies [10]. Looking forward, the field is moving toward higher resolution and deeper integration with spatial multi‑omics, where metabolites are interpreted alongside transcripts, proteins, and cellular states [12-15].
References
1. Xie P, Chen J, Wu P, Cai Z. Spatial Lipidomics Reveals Lipid Changes in the Cotyledon and Plumule of Mung Bean Seeds during Germination. J Agric Food Chem. 2023 Dec 13;71(49):19879-19887. doi: 10.1021/acs.jafc.3c06029.
2. Guan S, Liu C, Yao Z, Liu C, Ruan M, Wang R, Ye Q, Wan H, Li Z, Zhou G, Diao M, Cheng Y. Visualizing the spatial distribution of metabolites in tomato fruit at different maturity stages by matrix-assisted laser desorption/ionization mass spectrometry imaging. Food Res Int. 2025 Oct;218:117018. doi: 10.1016/j.foodres.2025.117018.
3. Zhao Y, Hu J, Zhang Y, Tao H, Li L, He Y, Zhang X, Zhang C, Hong G. Unveiling targeted spatial metabolome of rice seed at the dough stage using Matrix-Assisted Laser Desorption/Ionization Mass Spectrometry imaging. Food Res Int. 2023 Dec;174(Pt 1):113578. doi: 10.1016/j.foodres.2023.113578.
4. Feenstra AD, Alexander LE, Song Z, Korte AR, Yandeau-Nelson MD, Nikolau BJ, Lee YJ. Spatial Mapping and Profiling of Metabolite Distributions during Germination. Plant Physiol. 2017 Aug;174(4):2532-2548. doi: 10.1104/pp.17.00652. Epub 2017 Jun 20.
5. Liu T, Wang P, Chen Y, Sun B, Li Q, Wan H, Yang W, Ma P, Zhang D, Dong G, Chen S, Chen Q, Ma W, Sun W. LC-MS and MALDI-MSI-based metabolomic approaches provide insights into the spatial-temporal metabolite profiles of Tartary buckwheat achene development. Food Chem. 2024 Aug 15;449:139183. doi: 10.1016/j.foodchem.2024.139183.
6. Horn PJ, Chapman KD. Imaging plant metabolism in situ. J Exp Bot. 2024 Mar 14;75(6):1654-1670. doi: 10.1093/jxb/erad423.
7. Wheeler K, Gosmanov C, Sandoval MJ, Yang Z, McCall LI. Frontiers in Mass Spectrometry-Based Spatial Metabolomics: Current Applications and Challenges in the Context of Biomedical Research. Trends Analyt Chem. 2024 Jun;175:117713. doi: 10.1016/j.trac.2024.117713.
8. Xi H, Xu W, He F, Liu Z, Wang Y, Xie J. Spatial metabolome of biosynthesis and metabolism in Cyclocarya paliurus leaves. Food Chem. 2024 Jun 15;443:138519. doi: 10.1016/j.foodchem.2024.138519.
9. Yin Z, Huang W, Li K, Fernie AR, Yan S. Advances in mass spectrometry imaging for plant metabolomics-Expanding the analytical toolbox. Plant J. 2024 Sep;119(5):2168-2180. doi: 10.1111/tpj.16924.
10. Barmukh R, Garg V, Liu H, Chitikineni A, Xin L, Henry R, Varshney RK. Spatial omics for accelerating plant research and crop improvement. Trends Biotechnol. 2025 Aug;43(8):1904-1920. doi: 10.1016/j.tibtech.2025.03.007.
11. Horn PJ, Chapman KD. Lipidomics in situ: insights into plant lipid metabolism from high resolution spatial maps of metabolites. Prog Lipid Res. 2014 Apr;54:32-52. doi: 10.1016/j.plipres.2014.01.003.
12. Yu X, Liu Z, Sun X. Single-cell and spatial multi-omics in the plant sciences: Technical advances, applications, and perspectives. Plant Commun. 2023 May 8;4(3):100508. doi: 10.1016/j.xplc.2022.100508.
13. Rai M, Dutta M, Saito K, Rai A. A deep dive into plant metabolomics: Milestones, technologies, and translational impact. Plant Physiol. 2025 Nov 26;199(4):kiaf408. doi: 10.1093/plphys/kiaf408.
14. Min X, Zhao Y, Yu M, Zhang W, Jiang X, Guo K, Wang X, Huang J, Li T, Sun L, He J. Spatially resolved metabolomics: From metabolite mapping to function visualising. Clin Transl Med. 2024 Nov;14(11):e70031. doi: 10.1002/ctm2.70031.
15. Wu R, Veličković M, Burnum-Johnson KE. From single cell to spatial multi-omics: unveiling molecular mechanisms in dynamic and heterogeneous systems. Curr Opin Biotechnol. 2024 Oct;89:103174. doi: 10.1016/j.copbio.2024.103174.
Next-Generation Omics Solutions:
Proteomics & Metabolomics
Ready to get started? Submit your inquiry or contact us at support-global@metwarebio.com.
