Proteomics Quality Control: A Practical Guide to Reliable, Reproducible Data
Proteomics has become a cornerstone of modern biomedical research, enabling the largescale characterization of proteins across different biological systems. Mass spectrometry–based proteomics in particular has driven discoveries in disease mechanisms, biomarker identification, and therapeutic development. However, despite advances in instrumentation and computational analysis, the field continues to face a critical challenge: reproducibility. Without robust proteomics quality control (QC), even the most sophisticated datasets risk being compromised by technical variability, instrument drift, or systematic bias. This article explores why QC is indispensable in proteomics, the sources of experimental variability, and how comprehensive QC frameworks ensure reliable and reproducible data.
The Reproducibility Crisis in Proteomics
Reproducibility is the foundation of scientific research, yet in mass spectrometry proteomics, achieving consistency remains a daunting task. Studies have shown that even technical replicates often display only 35–60% overlap in identified peptides, while crossinstrument reproducibility can be even lower. This lack of consistency threatens the reliability of downstream analyses, especially in biomarker discovery where false signals can lead to wasted resources and misleading conclusions.
Largescale plasma proteomics studies highlight how the absence of standardized QC practices can introduce significant experimental variability. In complex disease contexts such as liver and kidney disorders, sample handling biases may overshadow true biological signals. As proteomics expands into clinical applications, robust QC measures are no longer optional but essential for trustworthy discoveries.
Sources of Variability in Mass Spectrometry Proteomics
To understand the importance of QC, it is necessary to examine where variability originates in the proteomics workflow. Variability can be introduced at nearly every stage of the analytical pipeline.
1. Sample Preparation Variability
Sample preparation is often the largest contributor to experimental variation. From collection and storage to protein extraction and digestion, every step can influence the final proteomic profile. In plasma proteomics, contamination by erythrocytes or platelets can distort the dataset, while oxidation or artificial modifications introduced during handling may skew quantification. For reliable results, the coefficient of variation (CV) for preparation steps such as digestion or labeling should be kept below 10%.
2. Chromatography and LC Separation
Liquid chromatography–mass spectrometry (LCMS/MS) remains the backbone of proteomics analysis. However, chromatography introduces its own challenges. Traditional nanoflow LC offers high sensitivity but suffers from poor reproducibility, with retention time CVs often exceeding 0.3%. Microflow LC, by contrast, demonstrates improved stability, achieving retention time CVs below 0.3% and quantification CVs under 7.5%. Monitoring chromatographic performance through parameters such as peak shape, symmetry, and pressure stability is crucial for reproducibility.
3. Instrument Performance Fluctuations
Even within the same model, mass spectrometers display performance drift over time. Ion source contamination, calibration errors, or declining resolution can reduce mass accuracy and quantification reliability. Regular monitoring of mass accuracy, signal intensity, and resolution—particularly for highresolution platforms like Orbitrap—is essential. For instance, maintaining resolution between 120k–240k FWHM ensures accurate detection of lowabundance proteins.
4. Bioinformatics and Data Processing Bias
Downstream computational analysis introduces another layer of potential bias. Variability in peptide identification algorithms, quantification methods, and missing value imputation strategies can result in significantly different outcomes from the same raw data. Naïve handling of missing values, such as zero replacement, can distort biological interpretation. Instead, modern imputation strategies (e.g., knearest neighbor or singular value decomposition) better preserve data integrity. Moreover, batch effects are a common problem in large datasets, often obscuring true biological differences unless corrected by statistical normalization methods.
Building a Comprehensive Proteomics QC Framework
Given these challenges, proteomics requires a multilayered quality control system spanning the entire workflow—from sample preparation to data interpretation.
QC in Sample Preparation
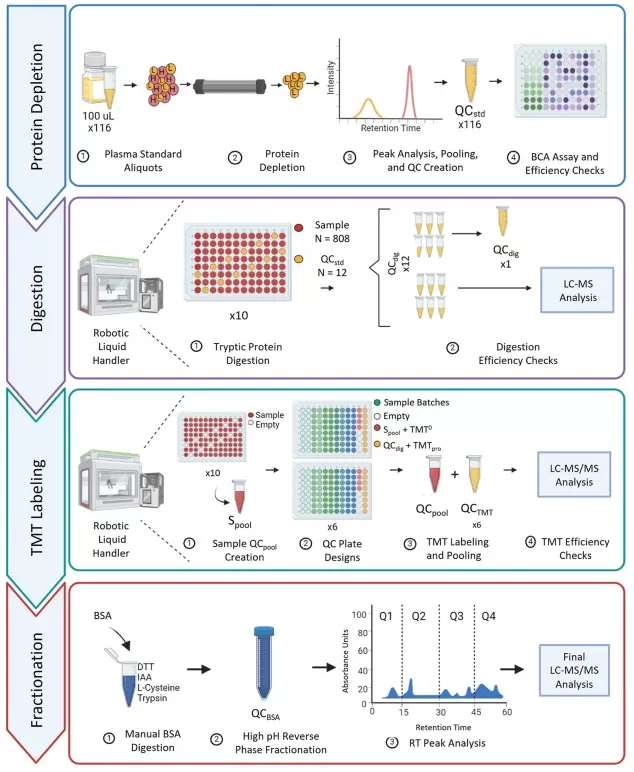
Dedicated QC samples should be embedded at different stages of processing to monitor consistency. For plasma proteomics, five categories of QC samples (QC_A–QC_E) have been suggested to evaluate critical steps such as depletion, digestion, labeling, and fractionation. By analyzing these regularly, laboratories can ensure that variability in preparation remains within acceptable limits.

An Example of QC Sample Setup for Sample Preprocessing [4] Source: Oliver NC, Choi MJ, Arul AB, Whitaker MD, Robinson RAS. “Establishing Quality Control Metrics for Large-Scale Plasma Proteomic Sample Preparation,” ACS Measurement Science Au (2024) 4(4):442–451. Licensed under CC BY 4.0 (https://creativecommons.org/licenses/by/4.0/). No endorsement implied.
Chromatographic QC Parameters
Chromatography QC involves tracking reproducibility of retention times, peak widths, and column pressure. Internal retention time standards such as indexed Retention Time (iRT) peptides provide an effective benchmark for system suitability checks. Consistent chromatographic behavior is essential for both discovery proteomics and targeted workflows. The specific criteria are shown in Table 1:
Table 1. Chromatographic Separation QC Criteria
|
Parameter |
Description |
Criterion |
|
Retention time |
Elution time of the peptide peak on the chromatogram |
CV < 5% |
|
Peak width |
Width of the peptide peak at baseline |
4–8 s |
|
Number of MS1 data points |
Number of MS1 acquisitions across a complete chromatographic peak |
> 5 |
|
Column pressure variation |
Pressure of the analytical column in the LC system |
Increase < 30% of the initial pressure |
Instrument QC Metrics
Comprehensive performance metrics are required for mass spectrometer monitoring. Key parameters include mass accuracy, signal intensity, and resolution. For high-resolution instruments such as Orbitrap, the resolution should be maintained at 120–240k FWHM to ensure accurate detection of low-abundance proteins. Instrument QC samples are typically composed of protein mixtures of known composition, such as the NCI-20 dynamic range protein mixture or Sigma UPS1 equimolar protein mixture, simple proteins such as BSA tryptic digest, or complex samples such as HeLa cell tryptic digest. Regular analysis of these samples allows assessment of instrument sensitivity, dynamic range, and quantitative accuracy. The specific criteria are shown in Table 2:
Table 2. Mass Spectrometer QC Criteria
|
Parameter |
Description |
Criterion |
|
Charge state distribution |
Proportion of peptide ions with different charge states |
2+ charge state should be predominant (~50%); 3+ charge state should account for 30–50% |
|
MS1 TIC (Total Ion Current) |
Intensity of MS signals over time |
TIC intensity variation < 30% |
|
MS1 mass error |
Deviation between measured and theoretical precursor ion mass |
< 5 ppm (Orbitrap) |
|
MS2 mass error |
Deviation between measured and theoretical fragment ion mass |
< 10 ppm (Orbitrap) |
|
Peak area of internal standard peptides (e.g., iRT) |
Peak area of standard peptides |
CV < 5% |
|
Technical replicate CV |
Coefficient of variation of peptide quantification across ≥3 replicates of QC-mix or standard peptide mixtures |
Quantitative CV < 20% for > 80% of shared proteins (no missing values); median CV < 20% |
|
Technical replicate correlation (R²) |
Correlation coefficient of peptide quantification across ≥3 replicates of QC-mix or standard peptide mixtures |
r > 0.95 |
|
Data completeness |
Proportion of commonly identified proteins across ≥3 replicates of QC-mix or standard peptide mixtures |
> 90% of proteins consistently detected (N = 3) |
Data Analysis QC Standards
At the informatics level, QC involves monitoring false discovery rates (FDRs), quantitative CVs, peptide identification rates, and missing data proportions. Multivariate statistical approaches like Principal Component Analysis (PCA) can identify batch effects or outliers, while Pareto charts highlight the most variable QC indicators. These tools enable researchers to quickly detect systematic errors and maintain robust data interpretation. The specific criteria are shown in Table 3:
Table 3. Data Analysis QC Criteria
|
Parameter |
Description |
Criterion |
|
False discovery rate (FDR) |
Lower FDR indicates fewer false positives and higher confidence in peptide identification |
< 1% (0.01) |
|
PSM count |
Number of matches between peptide spectra and theoretical database spectra |
≥ 1 |
|
Unique peptide |
Unique peptides can be used for both qualitative and quantitative analysis; more unique peptides support higher protein identification confidence |
≥ 1 |
|
Protein coverage |
Percentage of amino acids in the identified peptides relative to the full protein sequence; higher values indicate higher confidence |
≥ 70% |
|
Missing value rate |
Proportion of samples without quantitative values for a given protein; lower rates indicate higher data completeness |
> 70% of proteins with missing values < 50% |
|
Correlation between replicates |
Pearson correlation coefficient among replicate samples |
r > 0.9 |
|
Principal component analysis (PCA) |
Tight clustering of replicate QC samples indicates low variability and higher reliability |
QC samples cluster together without obvious batch effects |
Classification and Application of QC Samples in Proteomics Workflows
A comprehensive proteomics quality control strategy depends on the clear classification of QC samples and their practical use across the workflow. By distinguishing between different categories and linking them to sample preparation, instrument monitoring, and data evaluation, researchers can establish a more reliable framework for maintaining data consistency and reproducibility.
Types of QC Samples and Their Application Timing
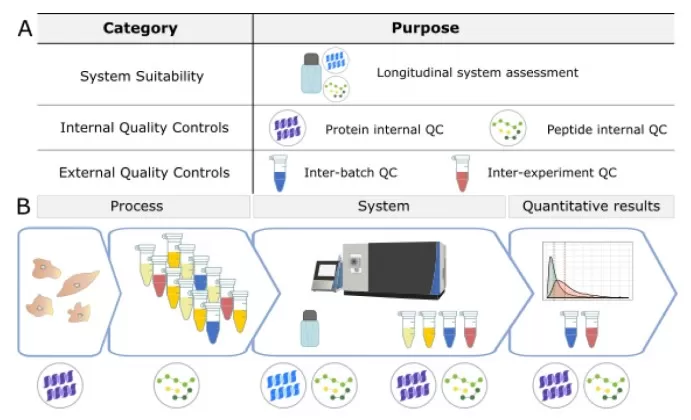
In proteomics research, QC samples are generally divided into three categories: system suitability QC, process monitoring QC, and longterm stability QC. System suitability QC samples are used to verify the performance of the LCMS/MS system both before and during data acquisition. Internal QC samples, spiked into experimental samples, assess deviations at the protein and peptide level introduced during sample preparation and help evaluate instrument functionality. External QC samples, prepared alongside experimental samples, serve to monitor batch effects and sample preparation consistency. Ideally, these external QC samples are generated by pooling experimental samples, prepared multiple times within the same batch, and should also contain the same internal standards as the experimental samples. Such external QC samples play a dual role: they can be used to assess sample preparation workflows or validate standardization strategies.
System suitability QC samples are typically run at the start of each experiment to confirm optimal instrument performance. Process monitoring QC samples are inserted at intervals during acquisition to track performance changes, while longterm stability QC samples help evaluate reproducibility across laboratories or over extended timeframes. For instance, in a largescale plasma proteomics study involving 808 samples, a strategy combining 16plex TMT labeling across 58 batches with QC samples effectively minimized experimental variability.

Three Types of QC Samples [14]
Sample Preparation, Quality Control, and Internal Standards
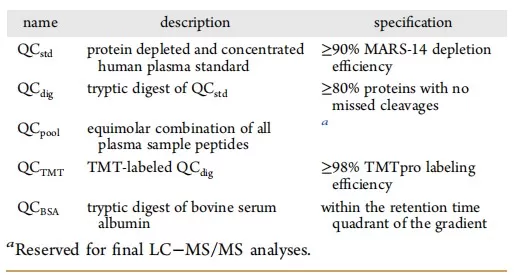
The sample preparation stage requires rigorous internal QC measures to ensure reproducibility. Standard QC practices should include protein concentration determination, evaluation of digestion efficiency, and checks of labeling efficiency. A critical aspect to consider is the introduction of artificial modifications, such as oxidative changes, during sample handling. These can significantly influence quantification results and therefore must be monitored using dedicated QC indicators.
In tandem mass tag (TMT) labeling experiments, batchtobatch variation in labeling efficiency is a common source of quantification bias. For this reason, establishing standardized QC thresholds for labeling efficiency is essential to maintain data reliability.

QC Indicators for Sample Preparation [4] Source: Oliver NC, Choi MJ, Arul AB, Whitaker MD, Robinson RAS. “Establishing Quality Control Metrics for Large-Scale Plasma Proteomic Sample Preparation,” ACS Measurement Science Au (2024) 4(4):442–451. Licensed under CC BY 4.0 (https://creativecommons.org/licenses/by/4.0/). No endorsement implied.
Instrument Performance Monitoring
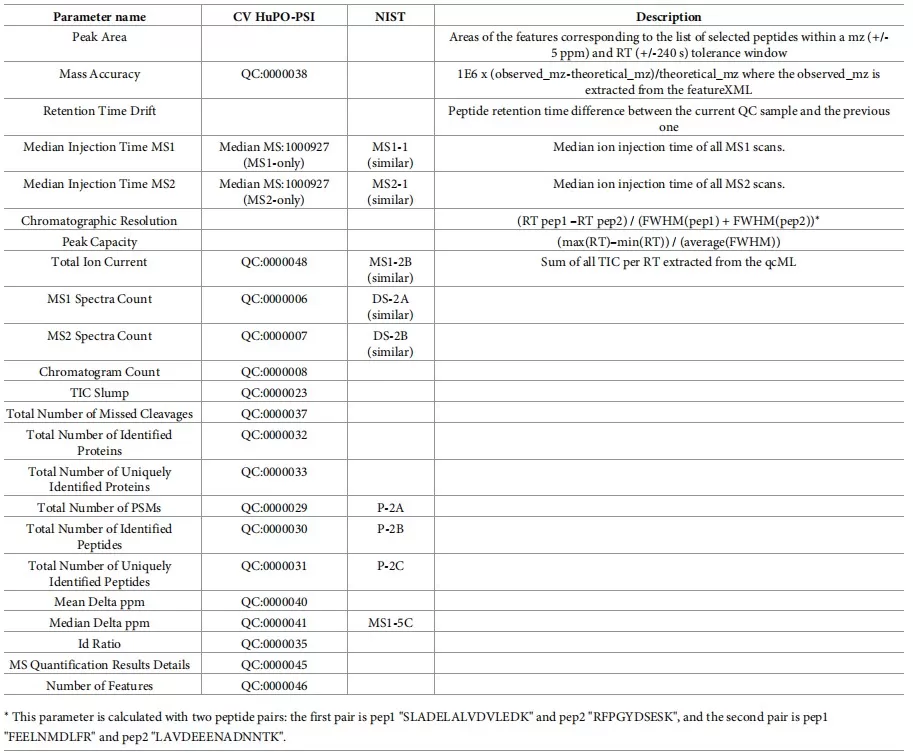
Realtime instrument performance monitoring is a crucial component of proteomics quality control. Tools such as QCART (Quality Control Analysis in RealTime) can dynamically flag potential issues during data acquisition, including declining instrument performance or sample quality problems. Compared to traditional postacquisition QC analysis, QCART provides the advantage of immediate feedback, enabling rapid corrective actions.
In addition, cloudbased platforms such as QCloud offer userfriendly interfaces for routine laboratory QC assessment and automated data processing. These digital solutions streamline performance tracking, reduce manual workload, and ensure consistency across multiple instruments and projects.

Real-Time Instrument Performance Monitoring Metrics on the QCloud Platform [17]
Data QC Metrics and Thresholds
Establishing robust data QC metrics and thresholds is fundamental to ensuring reliable outcomes in proteomics. In targeted proteomics workflows, five QC metrics independent of peptide identification can be monitored to evaluate system performance. For discovery proteomics, a comprehensive QC framework should include metrics such as peptide identification rates, protein sequence coverage, and quantification CVs.
Studies have shown that using negative controls and replicate samples during data processing can effectively eliminate unwanted variation and enhance the detection of true biological signals. Moreover, datadriven approaches are increasingly being adopted to optimize reproducibility, leading to more robust differential expression rankings. Control charts that track parameters such as peak area and retention time across acquisition runs (with thresholds set at ±2SD or ±3SD) are particularly effective for visualizing systematic drift and identifying outliers.

Control Chart of Peak Area and Retention Time over Acquisition Sequence (Thresholds Set at ±2SD or ±3SD) [19]
Summary and Future Perspectives on Proteomics Quality Control
Proteomics quality control has evolved from simple postexperiment assessments into a comprehensive framework spanning the entire analytical workflow. From sample preparation to data analysis, each step now requires tailored QC metrics and standardized benchmarks. Realtime QC tools such as QCART and cloud platforms like QCloud represent a new generation of QC innovations, offering immediate performance insights and enabling automated reporting.
Nonetheless, significant challenges remain. One major issue is the lack of standardization across laboratories, leading to inconsistent QC practices and limited crossstudy comparability. Looking forward, the development of proteomics QC is likely to focus on:
1. Establishing communitywide consensus QC standards and reference materials to harmonize workflows.
2. Developing more intelligent realtime monitoring and alert systems to proactively address instrument or sample issues.
3. Designing integrated QC strategies across multiomics platforms, ensuring consistency in proteogenomics and metabolomics studies.
4. Promoting automation and standardized QC reporting, reducing subjectivity and increasing transparency.
In diseasefocused research, particularly in complex conditions such as liver and kidney disorders, building diseasespecific QC marker panels will be instrumental in distinguishing true biomarkers from artifacts introduced during sample handling.
In conclusion, a comprehensive and standardized QC framework is indispensable for ensuring data quality and reproducibility in proteomics. As technology advances and community consensus strengthens, proteomics QC will continue to evolve toward greater automation, realtime monitoring, and interlaboratory standardization. Ultimately, these improvements will provide the foundation for more reliable discoveries and accelerate the integration of proteomics into biomedical and clinical research. If you need project-ready data, MetwareBio provides proteomics, metabolomics, lipidomics, multi-omics, and spatial metabolomics services backed by rigorous, end-to-end QC—from sample prep to instrument and data checks. Contact us to plan your study with confidence.
Read more
-
GSEA Enrichment Analysis: A Quick Guide to Understanding and Applying Gene Set Enrichment Analysis
-
Comparative Analysis of Venn Diagrams and UpSetR in Omics Data Visualization
Reference
1. Bittremieux W, Meysman P, Martens L, Valkenborg D, Laukens K. Unsupervised Quality Assessment of Mass Spectrometry Proteomics Experiments by Multivariate Quality Control Metrics. J Proteome Res. 2016;15(4):1300-1307. doi:10.1021/acs.jproteome.6b00028
2. Tabb DL, Vega-Montoto L, Rudnick PA, et al. Repeatability and reproducibility in proteomic identifications by liquid chromatography-tandem mass spectrometry. J Proteome Res. 2010;9(2):761-776. doi:10.1021/pr9006365
3. Poulos RC, Hains PG, Shah R, et al. Strategies to enable large-scale proteomics for reproducible research. Nat Commun. 2020;11(1):3793. Published 2020 Jul 30. doi:10.1038/s41467-020-17641-3
4. Oliver NC, Choi MJ, Arul AB, Whitaker MD, Robinson RAS. Establishing Quality Control Metrics for Large-Scale Plasma Proteomic Sample Preparation. ACS Meas Sci Au. 2024;4(4):442-451. Published 2024 Apr 29. doi:10.1021/acsmeasuresciau.3c00070
5. Geyer PE, Voytik E, Treit PV, et al. Plasma Proteome Profiling to detect and avoid sample-related biases in biomarker studies. EMBO Mol Med. 2019;11(11):e10427. doi:10.15252/emmm.201910427
6. Chiva C, Olivella R, Staes A, et al. A Multiyear Longitudinal Harmonization Study of Quality Controls in Mass Spectrometry Proteomics Core Facilities. J Proteome Res. 2025;24(2):397-409. doi:10.1021/acs.jproteome.4c00359
7. Dubois E, Galindo AN, Dayon L, Cominetti O. Assessing normalization methods in mass spectrometry-based proteome profiling of clinical samples. Biosystems. 2022;215-216:104661. doi:10.1016/j.biosystems.2022.104661
8. Stanfill BA, Nakayasu ES, Bramer LM, et al. Quality Control Analysis in Real-time (QC-ART): A Tool for Real-time Quality Control Assessment of Mass Spectrometry-based Proteomics Data. Mol Cell Proteomics. 2018;17(9):1824-1836. doi:10.1074/mcp.RA118.000648
9. Bian Y, Zheng R, Bayer FP, et al. Robust, reproducible and quantitative analysis of thousands of proteomes by micro-flow LC-MS/MS. Nat Commun. 2020;11(1):157. Published 2020 Jan 9. doi:10.1038/s41467-019-13973-x
10. Gao H, Zhu Y, Wang D, et al. iDIA-QC: AI-empowered data-independent acquisition mass spectrometry-based quality control. Nat Commun. 2025;16(1):892. Published 2025 Jan 21. doi:10.1038/s41467-024-54871-1
11. Shen M, Chang YT, Wu CT, et al. Comparative assessment and novel strategy on methods for imputing proteomics data. Sci Rep. 2022;12(1):1067. Published 2022 Jan 20. doi:10.1038/s41598-022-04938-0
12. Sundararaman N, Bhat A, Venkatraman V, et al. BIRCH: An Automated Workflow for Evaluation, Correction, and Visualization of Batch Effect in Bottom-Up Mass Spectrometry-Based Proteomics Data. J Proteome Res. 2023;22(2):471-481. doi:10.1021/acs.jproteome.2c00671
13. Tsantilas KA, Merrihew GE, Robbins JE, et al. A Framework for Quality Control in Quantitative Proteomics. J Proteome Res. 2024;23(10):4392-4408. doi:10.1021/acs.jproteome.4c00363
14. Bereman MS, Beri J, Sharma V, et al. An Automated Pipeline to Monitor System Performance in Liquid Chromatography-Tandem Mass Spectrometry Proteomic Experiments. J Proteome Res. 2016;15(12):4763-4769. doi:10.1021/acs.jproteome.6b00744
15. Pichler P, Mazanek M, Dusberger F, et al. SIMPATIQCO: a server-based software suite which facilitates monitoring the time course of LC-MS performance metrics on Orbitrap instruments. J Proteome Res. 2012;11(11):5540-5547. doi:10.1021/pr300163u
16. Olivella R, Chiva C, Serret M, et al. QCloud2: An Improved Cloud-based Quality-Control System for Mass-Spectrometry-based Proteomics Laboratories. J Proteome Res. 2021;20(4):2010-2013. doi:10.1021/acs.jproteome.0c00853
17. Shen S, Wang X, Zhu X, et al. High-quality and robust protein quantification in large clinical/pharmaceutical cohorts with IonStar proteomics investigation. Nat Protoc. 2023;18(3):700-731. doi:10.1038/s41596-022-00780-w
18. Rozanova S, Uszkoreit J, Schork K, et al. Quality Control-A Stepchild in Quantitative Proteomics: A Case Study for the Human CSF Proteome. Biomolecules. 2023;13(3):491. Published 2023 Mar 7. doi:10.3390/biom13030491
19. Bereman MS, Johnson R, Bollinger J, et al. Implementation of statistical process control for proteomic experiments via LC MS/MS. J Am Soc Mass Spectrom. 2014;25(4):581-587. doi:10.1007/s13361-013-0824-5
20. Pursiheimo A, Vehmas AP, Afzal S, et al. Optimization of Statistical Methods Impact on Quantitative Proteomics Data. J Proteome Res. 2015;14(10):4118-4126. doi:10.1021/acs.jproteome.5b00183
Next-Generation Omics Solutions:
Proteomics & Metabolomics
Ready to get started? Submit your inquiry or contact us at support-global@metwarebio.com.


