Choosing the Right Proteomics Data Analysis Software: A Comparison Guide
Selecting appropriate data analysis software is a critical step in LC-MS/MS quantitative proteomics workflows. The choice of software significantly influences peptide/protein identification and quantification, downstream statistical analyses, and the reproducibility of results. This guide is designed to assist researchers—ranging from mass spectrometry novices to bioinformatics experts and core facility staff—in understanding the importance of software selection and identifying the most suitable tools. With over a thousand proteomics data analysis tools available [1], narrowing down the options can be daunting. By focusing on widely used platforms and key decision factors, we provide a roadmap for making informed choices.
LC-MS/MS Proteomics Quantification Strategies
Several strategies are used in quantitative LC-MS/MS proteomics, including label-free quantification (LFQ), labeled quantification (TMT/iTRAQ/SILAC, etc.), and Data Independent Acquisition (DIA) methods. Each quantification approach requires software capable of handling its specific data characteristics.
How to Choose Proteomics Data Analysis Software: 7 Key Factors
1. Compatibility (Raw Data Formats): Ensure the software supports your instrument’s vendor format or open formats (mzML, mzXML, etc.). Thermo .raw, SCIEX WIFF, Bruker .d, and Agilent formats may each require specific support.
2. Quantification Strategy Support: Different tools specialize in distinct quantification methods. Confirm that the software aligns with your strategy—whether label-free, isobaric tagging (TMT/iTRAQ), metabolic labeling (SILAC), or DIA. Some tools, such as MaxQuant or FragPipe, are comprehensive, while others are more specialized.
3. Data Visualization Features: Effective visualization is crucial for quality control and interpretation. Robust software should provide volcano plots, PCA or multidimensional scaling plots for sample clustering, heatmaps of protein abundance, and interactive spectral viewers.
4. Usability (GUI vs. Command-Line): Ease of use varies considerably. Graphical User Interfaces (GUIs) are more intuitive for beginners, while command-line tools integrate better into custom pipelines and high-throughput workflows. Documentation and community support are also essential aspects of usability.
5. Reproducibility and Transparency: Open-source tools (e.g., Skyline, MaxQuant, OpenMS, FragPipe, DIA-NN) provide code visibility and community-driven improvements, while commercial software (e.g., Proteome Discoverer, Spectronaut) offers professional support but less transparency. Clear workflow documentation is vital for reproducibility.
6. Performance (Speed and Scalability): Large proteomics datasets require efficient tools. MSFragger (in FragPipe) enables ultra-fast spectrum searches, while DIA-NN uses neural networks to process DIA data rapidly on GPUs or CPUs. In contrast, older or GUI-heavy pipelines may be slower and more resource-intensive.
7. Cost and Licensing: Many academic tools are free and open-source (e.g., MaxQuant, Skyline, OpenMS, FragPipe, DIA-NN). Commercial options such as Proteome Discoverer or Spectronaut require paid licenses but often include dedicated support and training. Labs with limited budgets often prefer free tools, while commercial packages may provide unique features and superior integration.
MaxQuant and Perseus Proteomics Software (Max Planck Institute)
MaxQuant is a widely used, free proteomics platform that includes the Andromeda search engine [2-4], “match between runs” functionality, and MaxLFQ [5] for accurate label-free quantification. It supports multiple quantification methods (LFQ, SILAC, dimethyl, TMT/iTRAQ, and DIA via MaxDIA [6]) and is compatible with Thermo, Bruker, SCIEX, and Agilent formats. MaxQuant runs on both Windows (GUI) and Linux (command line).
Perseus, a companion tool, offers post-processing capabilities such as normalization, statistical testing (t-test, ANOVA), clustering, PCA, and enrichment analysis. It features an interactive workflow and plugin support, making it ideal for downstream interpretation of MaxQuant results. MaxQuant focuses on identification and quantification, while Perseus specializes in statistical analysis and visualization. Together, they provide a comprehensive, free pipeline for discovery proteomics.

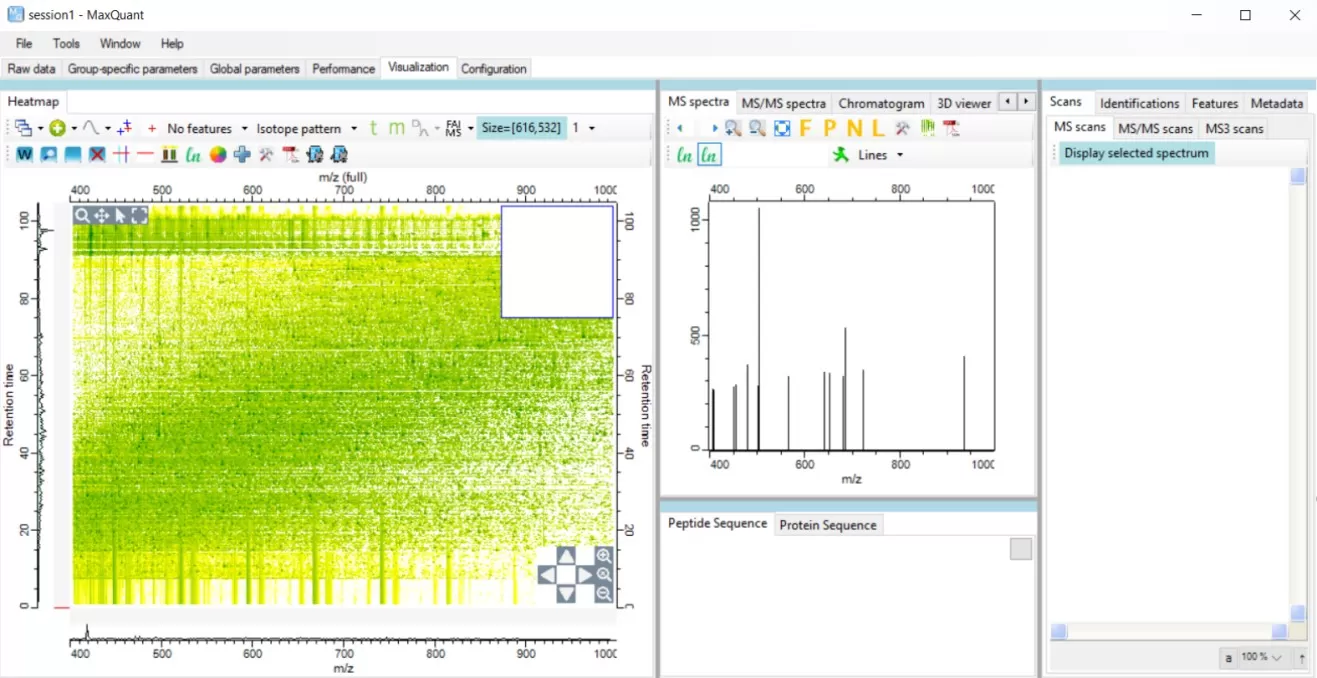
The visualization interface of MaxQuant
Proteome Discoverer (Thermo Fisher Scientific)
Proteome Discoverer (PD) is Thermo Fisher’s commercial suite optimized for Orbitrap instruments. It features a Windows GUI with a node-based workflow, integrates multiple search engines, and includes the Chimerys™ algorithm for improved peptide identification [7]. PD supports LFQ, SILAC, and TMT/iTRAQ quantification and has added DIA support since version 3.0. PD offers a user-friendly, Thermo-integrated solution with strong validation features. It is widely used in core facilities but comes with significant licensing costs.
Skyline Software for Targeted Proteomics and DIA (University of Washington)
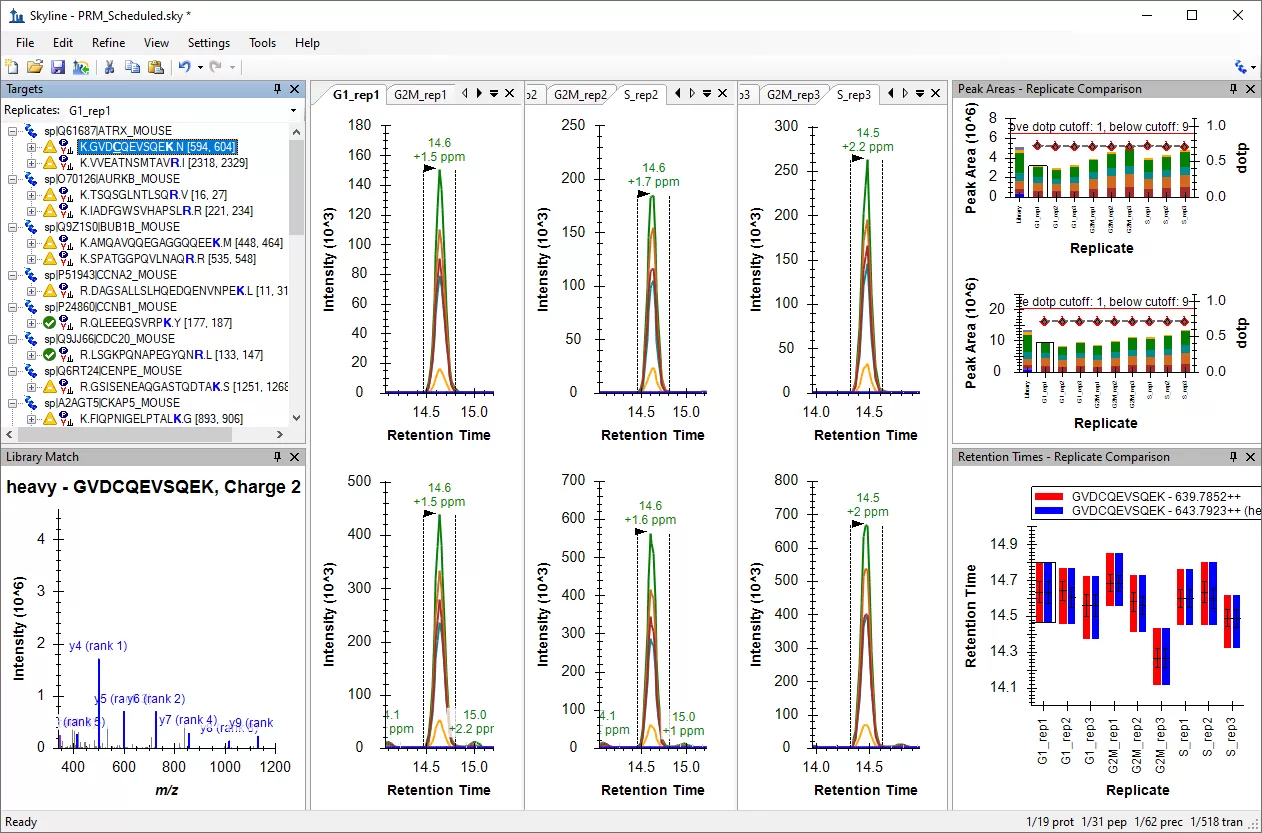
Skyline is a free, open-source tool initially developed for SRM/MRM and now supports PRM, DDA, and DIA [8]. It excels in visualization, enabling interactive exploration of chromatograms, spectra, retention times, calibration curves, and QC metrics. Skyline is particularly strong in targeted method development and DIA quantification. Skyline is a versatile tool with a clean GUI, extensive documentation, and strong community support, making it ideal for targeted and DIA proteomics.

An example of Skyline interface
Spectronaut DIA Proteomics Software (Biognosys)
Spectronaut is a commercial software widely considered the gold standard for DIA analysis [9, 10]. It supports both library-based and directDIA workflows, advanced machine learning, and extensive visualization options. It is vendor-agnostic and optimized for large-scale studies. Spectronaut offers high performance, scalability, and PTM support, making it ideal for precision DIA projects, though it comes at a significant cost.
FragPipe and MSFragger: Fast Open-Source Proteomics Software (University of Michigan)
FragPipe is a free, open-source toolkit built around the ultra-fast MSFragger search engine [11, 12]. It supports multiple quantification methods, DIA workflows, and PTM analysis, with strong performance in open modification searches. While its GUI is functional, it is less polished than commercial tools. FragPipe is a flexible, fast, and vendor-neutral platform, ideal for researchers seeking speed and customization without licensing costs.

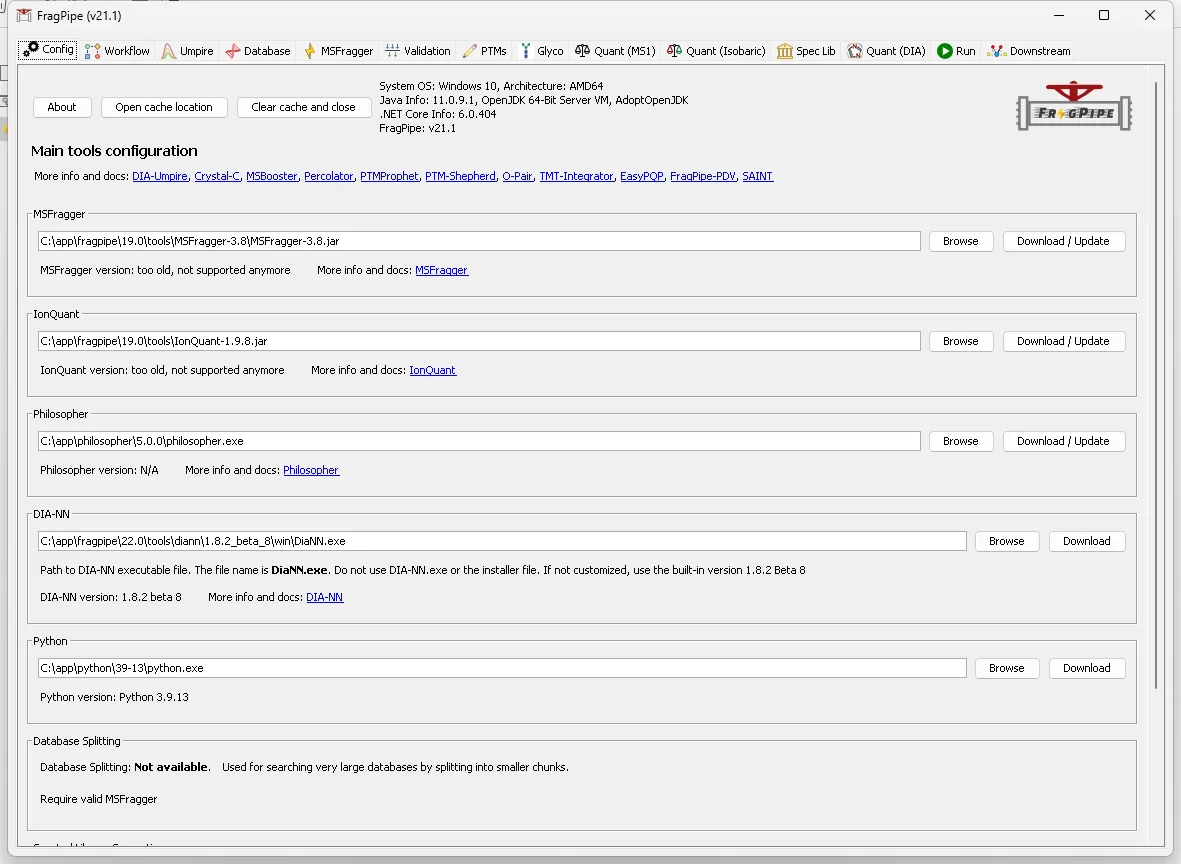
A general interface of Fragpipe platform
Core features: MSFragger search: Uses fragment indexing for extremely fast narrow- or open-modification searches without loss of sensitivity.
- FDR control: Integrates Percolator plus PeptideProphet/iProphet and ProteinProphet for robust validation.
- Quantification: TMT/iTRAQ via TMT-Integrator; label-free via IonQuant with match-between-runs and FDR control.
- DIA support: MSFragger-DIA and DIA-Umpire for library-free DIA, including diaPASEF; growing but less mature than DIA-NN/Spectronaut.
- PTM analysis: Crystal-C and PTM-Shepherd for interpreting and localizing modifications from open searches.
Usability: Runs on Windows/Linux (Java). GUI organizes parameters in tabs; built-in presets ease setup for LFQ or TMT. Executes pipelines via Philosopher tools; advanced users can run components on the command line or clusters. Output includes pepXML, protXML, TSV. Known for speed, especially on large/open searches.
Compatibility: Supports Thermo .raw, Bruker .d, SCIEX .wiff, mzML/mzXML, MGF via ProteoWizard; generally vendor-neutral, with mzML conversion as fallback.
Development & strengths: Actively maintained, open-source (Apache), with peer-reviewed algorithms. Excels at open modification searches, high-throughput datasets, and custom workflows. Comparable quant accuracy to other pipelines.
Limitations: UI less polished than commercial tools; limited integrated statistics—often requires export for advanced analysis. Nonetheless, rapid feature growth aims for an all-in-one open solution.
DIA-NN: High-Performance DIA Proteomics Software (Demichev/Ralser Lab)
DIA-NN is a free, high-performance DIA software that leverages deep neural networks for interference correction and spectral prediction [13]. It offers both library-based and library-free analyses, optimized speed, and scalability for large datasets. While its GUI is minimal, the command-line interface supports high-throughput workflows. DIA-NN delivers rapid, accurate, and scalable DIA analysis, making it a widely adopted alternative to commercial DIA software.

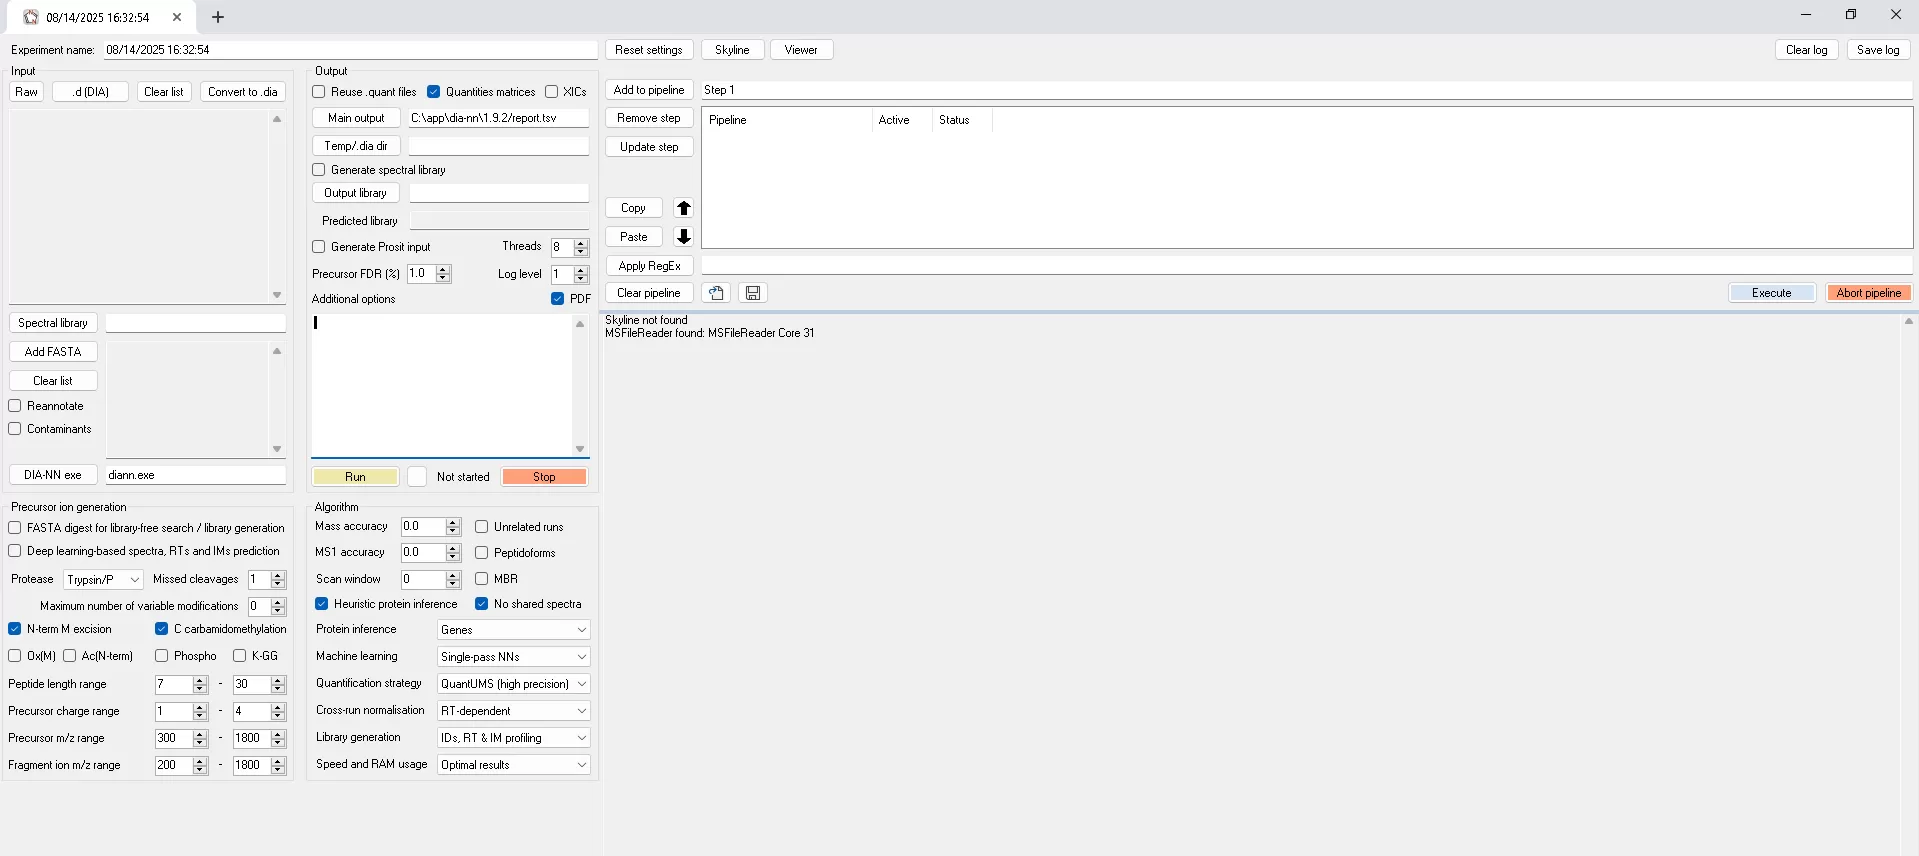
A general interface of DIA-NN software
Core features:
- Speed: C++ optimized, GPU-capable; processes hundreds of DIA runs in hours.
- Sensitivity & accuracy: ML-based scoring boosts true peptide detection, lowers FDR, and outperforms many traditional methods.
- Quantification: Real-time interference correction, precise precursor/fragment ion quantification, normalization options.
- Library generation: Builds spectral libraries from DDA runs or predicted spectra.
Usability: Initially CLI (Windows/Linux), now includes a basic Windows GUI for file/library selection and FDR settings. GUI is simpler than Spectronaut’s; CLI preferred for large scripted runs. Outputs tab-delimited peptide/protein quant tables for downstream tools (MSstats, Perseus).
Compatibility: Reads Thermo .raw, Sciex .wiff, Waters .raw, Bruker diaPASEF (4D feature detection), mzML (via vendor DLLs or conversion).
Performance: Scalable for large datasets; can search DIA files in minutes, enabling rapid iterative analysis.
Development & strengths: Free, actively updated (new features like scan mode DIA, VARIMAX). Enables high-quality DIA analysis without commercial software costs; often matches/exceeds Spectronaut in studies.
Limitations: Less polished GUI, minimal built-in visualization—designed for pure processing, with stats/plots done externally.
OpenMS/ OpenSWATH / KNIME: Modular Open-Source Proteomics Pipelines
OpenMS is a free, open-source C++ platform offering modular, vendor-neutral workflows. It supports LFQ, SILAC, TMT, and DIA (via OpenSWATH), with strong reproducibility and integration capabilities. Though highly flexible, it has a steeper learning curve for non-programmers. OpenMS is best suited for advanced users requiring customizable and reproducible workflows, though less appropriate for beginners.
Core features:
- Format support: Reads/writes mzML, mzXML, MGF, consensusXML, vendor formats via adapters.
- Feature finding & ID: LC-MS feature detection; wrappers for Mascot, XTandem, MS-GF+, Comet; integrated search; FDR tools (IDPosteriorErrorProbability, FalseDiscoveryRate).
- Quantification: Label-free, SILAC, iTRAQ, TMT; DIA/SWATH via OpenSWATH (one of the first open-source DIA tools).
- Processing & stats: Normalization, RT alignment, match-between-runs; exports to external stats/ML tools; PyOpenMS for Python scripting.
- Visualization: TOPPView for spectra; TOPPAS drag-and-drop workflow builder.
Flexibility: Highly modular; mix-and-match tools, script in C++/Python, or integrate with KNIME. Suited for method development and high-throughput, reproducible pipelines. Workflows shareable as XML for exact re-runs.
Usability: Steeper learning curve for non-coders; TOPPAS and KNIME nodes lower the barrier; strong documentation and example workflows. Best for advanced users/bioinformaticians.
Strengths & limits: Covers most proteomics needs; integrates external tools (e.g., Percolator); keeps pace with major methods (OpenSWATH still maintained). Lacks built-in cutting-edge ML like DIA-NN but excels in transparency, reproducibility, and customization.
Proteomics Software Comparison Table
The table below provides a comparative overview of the key features, capabilities, and requirements of the proteomics software packages discussed.
Comparative Summary of Proteomics Software Packages
|
Software |
Cost |
Formats |
Quant Methods |
GUI/CLI |
Stats Tools |
Visualization |
Best For |
|
MaxQuant |
Free |
Thermo, Bruker,Open Format |
LFQ, TMT/iTRAQ/SILAC,DIA |
GUI |
Yes (Perseus) |
Yes |
LFQ discovery |
|
Proteome Discoverer |
Commercial |
Thermo |
LFQ, TMT, SILAC |
GUI |
Yes |
Yes |
Beginner-friendly |
|
Skyline |
Free |
Multi-vendor |
Targeted,LFQ, DIA |
GUI |
Limited |
Yes |
Targeted proteomics |
|
Spectronaut |
Commercial |
Multi-vendor |
DIA |
GUI |
Yes |
Yes |
DIA workflows |
|
FragPipe + MSFragger |
Free |
Multi-vendor,Open Format |
LFQ, TMT/iTRAQ/SILAC,DIA |
GUI/CLI |
Limited |
Limited |
Fast all-rounder |
|
DIA-NN |
Free (Acad.) |
Multi-vendor,Open Format |
DIA |
GUI/CLI |
Built-in |
Limited |
High-throughput DIA |
|
OpenMS / KNIME |
Free |
Multi-vendor,Open Format |
LFQ, label-based |
CLI |
Limited |
Limited |
Custom pipelines |
Conclusion: Best Proteomics Software by Workflow and Use Case
Each proteomics data analysis software package has unique strengths. The best choice depends on the experiment type, dataset characteristics, and user preferences. DIA workflows often rely on Spectronaut or DIA-NN, while TMT labeling workflows may favor Proteome Discoverer. Researchers seeking open-source customization may prefer MaxQuant/Perseus or FragPipe, and targeted proteomics projects benefit from Skyline. Many labs combine tools for complementary strengths. Careful parameter selection, validation, and statistical analysis remain essential for reliable conclusions.
The proteomics software landscape continues to evolve with emerging algorithms, including AI-driven approaches. Staying updated through community resources and comparison studies helps refine tool selection. By considering compatibility, quantification needs, available features, usability, and cost, researchers can select the most suitable solution. The tools reviewed—MaxQuant/Perseus, Proteome Discoverer, Skyline, Spectronaut, FragPipe/MSFragger, DIA-NN, and OpenMS—represent established options covering a broad range of quantitative proteomics applications. With the right choice or combination, researchers can extract robust insights from LC-MS/MS experiments and advance our understanding of the proteome.
References
1. Tsiamis, V., et al., One Thousand and One Software for Proteomics: Tales of the Toolmakers of Science. J Proteome Res, 2019. 18(10): p. 3580-3585.
2. Tyanova, S., T. Temu, and J. Cox, The MaxQuant computational platform for mass spectrometry-based shotgun proteomics. Nat Protoc, 2016. 11(12): p. 2301-2319.
3. Cox, J., et al., A practical guide to the MaxQuant computational platform for SILAC-based quantitative proteomics. Nat Protoc, 2009. 4(5): p. 698-705.
4. Cox, J. and M. Mann, MaxQuant enables high peptide identification rates, individualized p.p.b.-range mass accuracies and proteome-wide protein quantification. Nat Biotechnol, 2008. 26(12): p. 1367-72.
5. Cox, J., et al., Accurate proteome-wide label-free quantification by delayed normalization and maximal peptide ratio extraction, termed MaxLFQ. Mol Cell Proteomics, 2014. 13(9): p. 2513-26.
6. Sinitcyn, P., et al., MaxDIA enables library-based and library-free data-independent acquisition proteomics. Nat Biotechnol, 2021. 39(12): p. 1563-1573.
7. Frejno, M., et al., Unifying the analysis of bottom-up proteomics data with CHIMERYS. Nat Methods, 2025. 22(5): p. 1017-1027.
8. Prakash, A., et al., Expediting the development of targeted SRM assays: using data from shotgun proteomics to automate method development. J Proteome Res, 2009. 8(6): p. 2733-9.
9. Bruderer, R., et al., Extending the limits of quantitative proteome profiling with data-independent acquisition and application to acetaminophen-treated three-dimensional liver microtissues. Mol Cell Proteomics, 2015. 14(5): p. 1400-10.
10. Bekker-Jensen, D.B., et al., Rapid and site-specific deep phosphoproteome profiling by data-independent acquisition without the need for spectral libraries. Nat Commun, 2020. 11(1): p. 787.
11. Kong, A.T., et al., MSFragger: ultrafast and comprehensive peptide identification in mass spectrometry-based proteomics. Nat Methods, 2017. 14(5): p. 513-520.
12. Yu, F., et al., Fast Quantitative Analysis of timsTOF PASEF Data with MSFragger and IonQuant. Mol Cell Proteomics, 2020. 19(9): p. 1575-1585.
13. Demichev, V., et al., DIA-NN: neural networks and interference correction enable deep proteome coverage in high throughput. Nat Methods, 2020. 17(1): p. 41-44.
Next-Generation Omics Solutions:
Proteomics & Metabolomics
Ready to get started? Submit your inquiry or contact us at support-global@metwarebio.com.


