
Untargeted Spatial Lipidomics
Untargeted Spatial Lipidomics
Overview of Untargeted Spatial Lipidomics
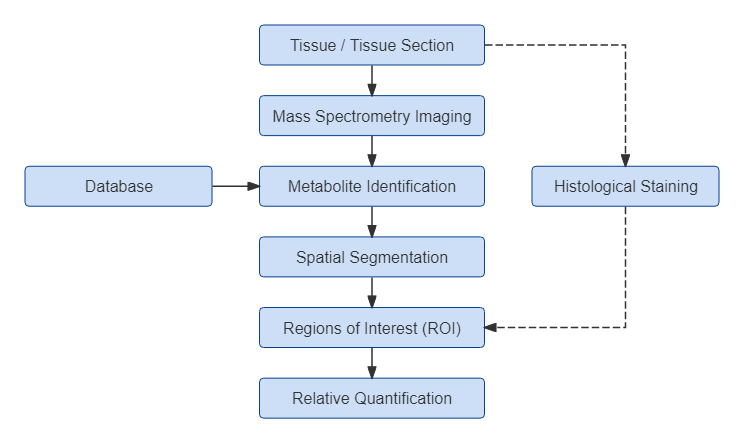
The Technical Workflow of Untargeted Spatial Lipidomics Based on MALDI-MSI
Why Choose MetwareBio for Spatial Lipidomics Service?
Comprehensive Lipid Annotation with a 2,900+ Spatial Lipidomics Database
|
Class Ⅰ |
Class Ⅱ |
Number |
|
Fatty Acyls (FA) |
CAR, FFA |
120+ |
|
Glycerolipids (GL) |
MG, TG, TG-O, MGDG, DG, DG-O |
710+ |
|
Glycerophospholipids (GP) |
LPC, LPC-O, LPE, LPG, LPS, PC, PC-O, PE, PE-O, PG, PS, LPI, PI, LPA, PA, PMeOH |
1400+ |
|
Sphingolipids (SL) |
CerP,HexCer, SM, Cer |
660+ |
|
Sterol Lipids (ST) |
Cho, CE |
30+ |
|
Prenol Lipids (PR) |
CoQ |
3 |
|
In total |
2900+ |
|
Spatial Lipidomics Workflow
Publication-Ready Deliverables for Spatial Lipidomics Analysis
Applications of Untargeted Spatial Lipidomics
Untargeted spatial lipidomics enables in situ profiling of lipid distributions in complex tissues, supporting research on disease mechanisms, tumor microenvironment (TME), and lipid-associated biomarkers. By mapping tissue-resolved lipid patterns, this approach helps uncover region-specific lipid alterations, metabolic reprogramming, and microenvironmental heterogeneity in human and animal disease models.
In pharmacology and translational research, spatial lipidomics supports investigation of drug tissue distribution, spatial pharmacokinetics (DMPK), toxicity assessment, and target engagement. Spatially resolved lipid profiling provides insight into how therapeutics influence tissue-specific lipid metabolism, aiding mechanism-of-action studies and preclinical evaluation.
For animal studies, untargeted spatial lipidomics enables detailed analysis of reproductive development, nutrient metabolism, disease mechanisms, and toxicological responses across diverse tissues. This approach allows researchers to visualize tissue-specific lipid organization and dynamic metabolic changes, supporting both basic and applied research.
In plant science, spatial lipidomics enables visualization of active lipid compounds, reproductive development, stress responses, and metabolite localization related to crop traits. By capturing tissue-resolved lipid distributions, this technology provides insight into plant adaptation, quality traits, and metabolic regulation, supporting breeding and functional genomics studies.
Sample Requirements for Spatial Metabolomics Service
- Embedding Medium: CMC is recommended for optimal tissue support during sectioning.
- Tissue Cross-section Size: 1.5 × 1.5 mm (min) – 50 × 30 mm (max)
- Tissue Height: 2 mm (min) – 25 mm (max)
- Storage & Shipment: Store samples in a frozen tissue storage box and ship on dry ice to maintain sample integrity.
- Slide Type: ITO-coated slides are required for MALDI-MSI analysis.
- Maximum Scanning Area: 65 × 40 mm
- Section Thickness: 8–50 µm
- Storage & Shipment: Store sections in a slide box and ship on dry ice.
FAQ about Untargeted Spatial Lipidomics Service
Untargeted spatial lipidomics combines mass spectrometry imaging (MSI) with lipid profiling to visualize the distribution and relative abundance of lipids directly within tissue sections. Unlike bulk lipidomics, it preserves tissue architecture and reveals where specific lipid species are localized, enriched, or redistributed, enabling studies of tissue-specific lipid organization, heterogeneity, and metabolic remodeling.
Untargeted spatial metabolomics provides broad coverage of most small-molecule metabolites using a general analysis workflow and annotation via the spatial metabolomics database. It typically detects 1,400+ compounds, including various metabolite classes and some lipids, making it ideal for exploratory studies of diverse metabolic pathways.
Untargeted spatial lipidomics, in contrast, is specifically optimized for lipid detection. It uses lipid-focused methods and a dedicated lipid database, with typical detection of 600+ lipids in animal tissues, providing higher-confidence lipid identification. This approach is ideal for studies specifically focused on lipid metabolism and spatial lipid organization.
Samples can be submitted as fresh-frozen tissue blocks or tissue sections. Tissue blocks should be rapidly dissected under cold conditions and embedded in a suitable medium (e.g., CMC or FSC22). Sections should be cut to 8–50 µm thickness and mounted on ITO-coated slides for MALDI-MSI analysis. Storage at −80°C and dry ice shipping is required. For sections, 4 per sample are recommended: 1 for H&E staining, 3 for MSI analysis or backup.
For MALDI-based Spatial Lipidomics, available spatial resolutions include 5, 10, 20, 50, and 100 µm.
The resolution should be chosen based on the sample type, the spatial heterogeneity of the lipids, and the desired level of detail for analysis. For large or heterogeneous samples (e.g., organs), lower resolutions (100 µm to 50 µm) are typically sufficient to observe broad metabolite distributions, while higher resolutions (10 µm to 5 µm) are necessary for smaller, more homogeneous samples (e.g., cellular or subcellular structures) to capture finer details. If lipids are widely distributed, a lower resolution is adequate, but if they are localized to small regions (e.g., organelles or specific cell types), a higher resolution provides better visualization of spatial heterogeneity.
Typical Resolutions Used:
- 100 µm: Suitable for large tissue sections or general metabolite distribution mapping.
- 50 µm: Provides a good balance between resolution and data volume for tissues or larger regions of interest.
- 20 µm: Used for more detailed mapping of tissue microstructures.
- 10 µm or 5 µm: High-resolution imaging for single cells or specific subcellular structures.
Different lipid classes respond better to specific ionization modes due to their chemical properties. For example, MG, DG, and TG (glycerolipids) are detected more efficiently in positive ion mode, while FFA, LPG, and LPS perform better in negative ion mode. Some lipids, such as Cer and SM, show similar detection in both modes. If you have specific lipid classes of interest, please contact us, and we will select the optimal ionization mode tailored to your study.
Next-Generation Omics Solutions:
Proteomics & Metabolomics
Ready to get started? Submit your inquiry or contact us at support-global@metwarebio.com.
