Why You Must Correct Batch Effects in Transcriptomics Data?
Batch effects are a common challenge in transcriptomics studies, introducing unwanted technical variation that can distort true biological signals. This guide provides a comprehensive overview of how to understand, detect, minimize, and correct batch effects—covering both experimental design strategies and statistical correction tools. With visual examples and method comparisons, this article supports both beginners and experienced researchers seeking to improve the quality and reproducibility of transcriptomic data.
What Is a Batch Effect in Transcriptomics?
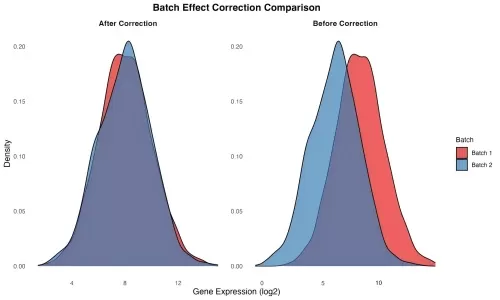
In transcriptomics, a batch effect refers to systematic, non-biological variation introduced into gene expression data. These effects are often caused by technical inconsistencies during sample collection, library preparation, or sequencing. Examples include running samples on different days, using different sequencing machines, variations in reagent lots, or processing by different personnel. Even biologically identical samples may show significant differences in expression due to these technical influences. This issue can impact both bulk and single-cell RNA-seq data and may mask real biological signals or create false positives. To better understand these sources, the table below summarizes major causes of batch effects across various experimental conditions.

transcriptomics-batch-effect-before-after
What Causes Batch Effects in Transcriptomics?
|
Category |
Examples |
Applies to |
|
Sample Preparation Variability |
Different protocols, technicians, enzyme efficiency |
Bulk & single-cell RNA-seq |
|
Sequencing Platform Differences |
Machine type, calibration, flow cell variation |
Bulk & single-cell RNA-seq |
|
Library Prep Artifacts |
Reverse transcription, amplification cycles |
Mostly bulk RNA-seq |
|
Reagent Batch Effects |
Different lot numbers, chemical purity variations |
All types |
|
Environmental Conditions |
Temperature, humidity, handling time |
All types |
|
Single-cell/Spatial Specific |
Slide prep, tissue slicing, barcoding methods |
scRNA-seq & spatial transcriptomics |
How Batch Effects Skew Differential Expression Analysis
One of the most critical consequences of batch effects in transcriptomic data is their impact on differential expression analysis. When samples cluster by technical variables rather than biological conditions, statistical models may falsely identify genes as differentially expressed. This introduces a high false-positive rate, misleading researchers and wasting downstream validation efforts. Conversely, true biological signals may be masked, resulting in missed discoveries.
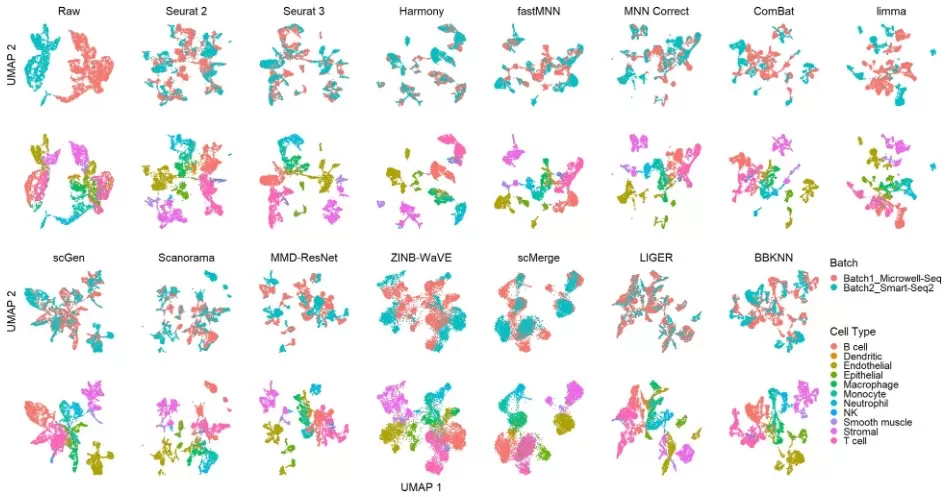
Dimensionality reduction techniques such as UMAP and unsupervised clustering often reveal this issue by showing that samples group primarily by batch rather than treatment or phenotype. The example below demonstrates how different batch correction methods affect clustering outcomes on single-cell RNA-seq data from the Mouse Cell Atlas (dataset 2). Cells are visualized using UMAP, colored by batch (top row) and cell type (bottom row), allowing qualitative comparison across 14 correction tools. This highlights why accurate batch correction is essential—not only for statistical rigor, but also for preserving biological meaning.

umap_batch_effect_methods_mouse (Tran HTN et al. , 2020)
Common Correction Methods in Transcriptomics
A variety of statistical methods have been developed to address batch effects in transcriptomic datasets. The most widely used approaches include:
- Combat: One of the most established tools, Combat uses an empirical Bayes framework to adjust for known batch variables. It is especially effective for structured bulk RNA-seq data where batch information is clearly defined.
- SVA (Surrogate Variable Analysis): SVA estimates hidden sources of variation that may represent batch effects and removes them from the model. It is useful when batch variables are unknown or partially observed but requires careful modeling to avoid overcorrection.
- limma removeBatchEffect: Part of the limma package in R, this function applies linear modeling-based correction and is frequently integrated into differential expression workflows. It works well when batch variables are known and additive.
- Harmony: For single-cell or spatial RNA-seq data, Harmony aligns cells in a shared embedding space to reduce batch-driven clustering. It is compatible with Seurat workflows and preserves biological variation.
- fastMNN (Mutual Nearest Neighbors): A single-cell batch correction tool that identifies mutual neighbors across batches to correct batch-specific shifts, ideal for complex cellular structures.
- Scanorama: A Python-based method that performs nonlinear manifold alignment across batches, suitable for integrating data from different platforms or technologies.
Each method offers different strengths depending on your dataset’s structure, the availability of batch metadata, and whether you are working with bulk or single-cell RNA-seq.

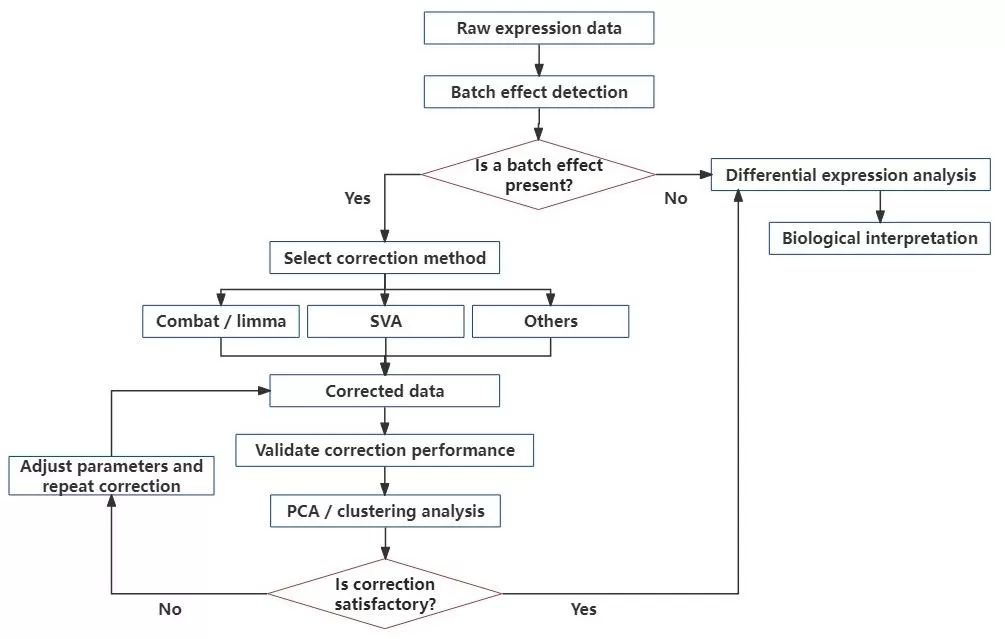
transcriptomic-batch-correction-workflow
Comparing Popular Methods: Combat vs SVA vs limma removeBatchEffect
The table below provides a concise comparison of three popular batch correction methods used in transcriptomic analysis.
|
Method |
Strengths |
Limitations |
|
Combat |
Simple, widely used; adjusts known batch effects using empirical Bayes |
Requires known batch info; may not handle nonlinear effects |
|
SVA |
Captures hidden batch effects; suitable when batch labels are unknown |
Risk of removing biological signal; requires careful modeling |
|
limma removeBatchEffect |
Efficient linear modeling; integrates with DE analysis workflows |
Assumes known, additive batch effect; less flexible |
Best Practices for Detection and Validation
Validating batch correction is a critical yet often overlooked step in transcriptomic analysis. The presence of batch effects is commonly detected using dimensionality reduction methods like PCA or UMAP, where samples may cluster by batch rather than by biological condition. After correction, successful normalization should result in grouping by biological identity.
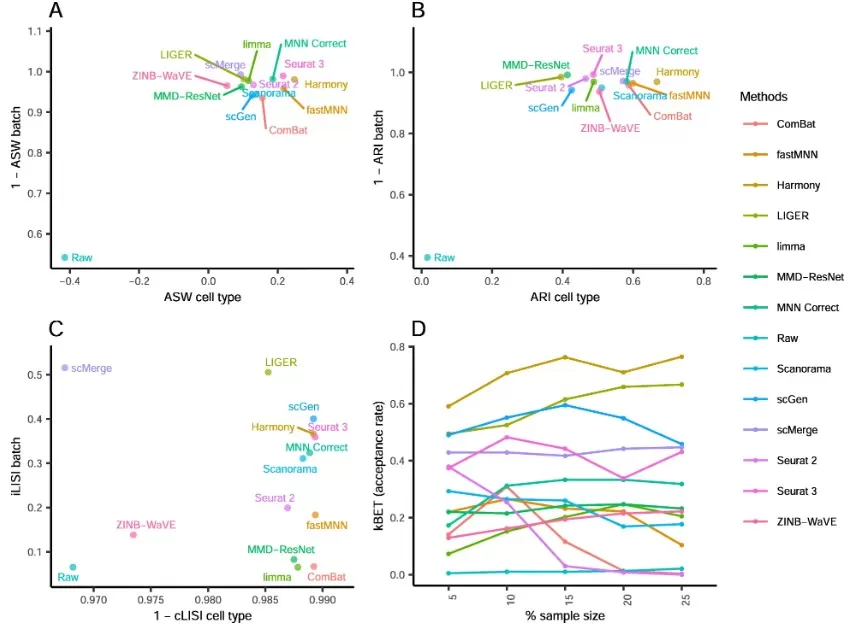
Beyond visual inspection, several quantitative metrics can be used to assess correction quality. These include Average Silhouette Width (ASW), Adjusted Rand Index (ARI), Local Inverse Simpson’s Index (LISI), and the k-nearest neighbor Batch Effect Test (kBET). Each metric evaluates different aspects of correction—such as clustering tightness, batch mixing, and preservation of cell identity.
The example below shows how 14 different methods perform across these four metrics using single-cell data from the Mouse Cell Atlas. Methods in the top-right regions of ASW, ARI, and LISI plots, or with higher kBET acceptance rates, are generally considered better-performing. To ensure robust results, it is recommended to combine both visualizations and quantitative metrics when validating batch correction.

batch_correction_metrics_comparison (Tran HTN et al. , 2020)
Experimental Design Tips to Minimize Batch Effects
The best way to manage batch effects is to minimize them during experimental design. Begin by randomizing samples across batches so that each condition is represented within each processing batch. Balance biological groups across time, operators, and sequencing runs. Use consistent reagents and protocols throughout the study, and avoid processing all samples of one condition together. Pooled quality control (QC) samples and technical replicates across batches are also valuable for later correction and validation. Preventive design decisions can significantly reduce reliance on post-hoc computational correction.
How Does It Differ from Metabolomics Batch Correction?
While both transcriptomics and metabolomics suffer from batch effects, the approaches to correction differ. In metabolomics, batch correction typically relies on QC samples and internal standards spiked into every run, enabling instrument drift modeling. See how batch effects are addressed in metabolomics workflows. Transcriptomics correction, however, often lacks physical standards and depends more on statistical modeling like Combat or SVA. Moreover, transcriptomic batch effects tend to be more complex due to library preparation steps, amplification, and platform sensitivity. Thus, metabolomics uses more signal-based corrections, whereas transcriptomics relies on model-based estimation and adjustment.
FAQs: Answers to Key Concerns
Q1: What’s the difference between Combat and SVA?
A: Combat requires known batch labels and uses a Bayesian framework, while SVA estimates hidden variables representing batch-like effects.
Q2: Can batch correction remove true biology?
A: Yes. Overcorrection may remove real biological variation if batch effects are correlated with the experimental condition. Always validate.
Q3: Do I always need batch correction?
A: If samples cluster by batch in PCA/UMAP plots or show known batch-driven trends, correction is highly recommended.
Q4: How many batches or replicates are needed?
A: At least two replicates per group per batch is ideal. More batches allow more robust statistical modeling.
Q5: What metrics show successful correction?
A: Visual clustering, replicate consistency, and quantitative scores like kBET, ARI, or silhouette width help assess correction success.
Conclusion
Batch effects are a persistent challenge in transcriptomic research, but with proper detection, correction, and experimental design, they can be effectively managed. Whether using tools like Combat, SVA, or integration models for single-cell data, it is essential to validate correction methods and document their impact. By minimizing technical noise, researchers can ensure the biological accuracy, reproducibility, and impact of their transcriptomic analyses.
Reference
Tran HTN, Ang KS, Chevrier M, et al. A benchmark of batch-effect correction methods for single-cell RNA sequencing data. Genome Biol. 2020;21(1):12. Published 2020 Jan 16. doi:10.1186/s13059-019-1850-9
Read more
- Metabolomics Batch Effects
- Understanding WGCNA Analysis in Publications
- Deciphering PCA: Unveiling Multivariate Insights in Omics Data Analysis
- Metabolomic Analyses: Comparison of PCA, PLS-DA and OPLS-DA
- WGCNA Explained: Everything You Need to Know
- Harnessing the Power of WGCNA Analysis in Multi-Omics Data
- Beginner for KEGG Pathway Analysis: The Complete Guide
- GSEA Enrichment Analysis: A Quick Guide to Understanding and Applying Gene Set Enrichment Analysis
- Comparative Analysis of Venn Diagrams and UpSetR in Omics Data Visualization
Next-Generation Omics Solutions:
Proteomics & Metabolomics
Ready to get started? Submit your inquiry or contact us at support-global@metwarebio.com.


