PLS-DA vs PCA: Key Differences and Use Cases in Omics Analysis
Introduction: Choosing Between PCA and PLS-DA in Omics Analysis
Principal Component Analysis (PCA) and Partial Least Squares Discriminant Analysis (PLS-DA) are two widely used multivariate statistical methods for dimensionality reduction and pattern recognition in omics research. While PCA is an unsupervised technique commonly employed for data exploration, PLS-DA is a supervised approach designed to enhance class separation. In metabolomics, proteomics, and other omics fields—where datasets are high-dimensional and complex—choosing the appropriate analysis method is crucial for extracting meaningful biological insights.
This article presents a side-by-side comparison of PCA and PLS-DA, covering their underlying principles, strengths, limitations, and use cases, to help researchers make informed decisions when analyzing omics data.
Notably, PLS-DA is particularly valuable in biomarker discovery and predictive modeling, setting it apart from PCA’s focus on exploratory analysis.
What Is PCA (Principal Component Analysis)?
PCA (Principal Component Analysis) is an unsupervised statistical method that reduces high-dimensional data by identifying new axes (principal components) that capture the greatest variance within the dataset. Samples are projected onto these components, with the first few typically explaining most of the total variance.
Use Cases:
- Preliminary data exploration
- Detecting outliers
- Evaluating sample repeatability
- Visualizing overall data structure
Limitations:
- Ignores sample group information
- May result in poor class separation for complex biological samples

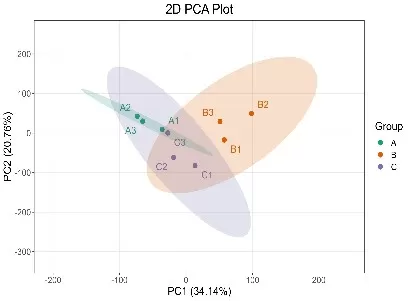
2D PCA Score Plot with Group Clusters and Variance Contribution
PCA is ideal for identifying trends, visualizing structure, and detecting outliers in complex datasets.
For a more detailed explanation of PCA’s methodology and applications, see our full guide: Deciphering PCA: Unveiling Multivariate Insights in Omics Data Analysis.
What Is PLS-DA (Partial Least Squares Discriminant Analysis)?
PLS-DA (Partial Least Squares Discriminant Analysis) is a supervised method that incorporates known class labels to maximize separation between predefined groups. It identifies latent variables that capture the covariance between the predictors (e.g., metabolite concentrations) and the response variable (group labels), allowing improved group classification.
Use Cases:
- Classification of experimental groups
- Biomarker identification
- Predictive modeling
Advantages:
- Maximizes separation between sample classes
- Outputs VIP (Variable Importance in Projection) scores to aid feature selection
Limitations:
- Prone to overfitting with small or noisy datasets
- Requires model validation through cross-validation or permutation testing

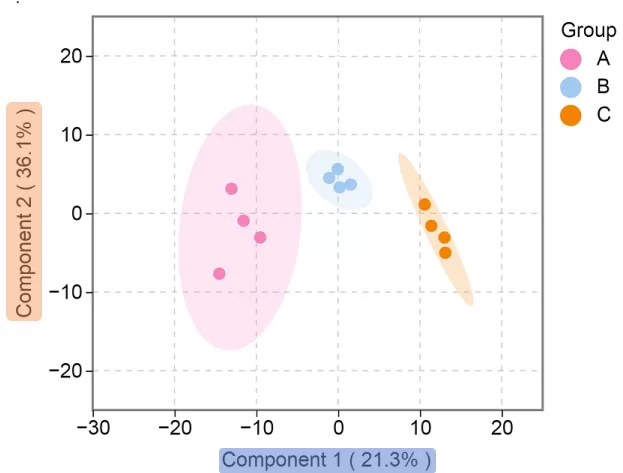
Principal Component Score Plot for Intra- and Inter-group Variability
Scatter Plot Interpretation: Each point represents a sample, where colors distinguish predefined groups, and concentric circles denote 95% confidence intervals.
Axes Labels:
Component 1 (X-axis): Predicted principal component scores reflecting inter-group variability. The percentage indicates the proportion of total variance explained by this component.
Component 2 (Y-axis): Principal component scores reflecting intra-group sample variability. The percentage denotes the explained variance contribution to the total dataset.
PLS-DA vs PCA: Key Differences
PCA and PLS-DA are both powerful tools for dimensionality reduction, but they serve different analytical purposes. PCA seeks to retain the most variance in the dataset without using class labels, making it ideal for data overview and quality assessment. In contrast, PLS-DA leverages class label information to enhance separation between predefined groups, making it a better choice for classification and biomarker identification.
The table below summarizes the most important distinctions between these two approaches:
|
Feature |
PCA |
PLS-DA |
|
Supervision |
Unsupervised |
Supervised |
|
Use of group information |
No |
Yes |
|
Primary objective |
Capture overall variance |
Maximize class separation |
|
Model interpretability |
Moderate |
High (via VIP scores) |
|
Risk of overfitting |
Low |
Moderate to high |
|
Best suited for |
Exploratory analysis |
Classification and biomarker discovery |
When Should You Use PCA or PLS-DA?
Choosing between PCA and PLS-DA depends on your analytical objectives and the nature of your dataset. While PCA offers a neutral, assumption-free view of data structure, PLS-DA is designed to highlight group differences and enable classification. The guidelines below will help determine which method is best for your specific research scenario:
Choose PCA when:
- You want an unbiased view of the data's structure
- Checking for batch effects or sample reproducibility
- Identifying potential outliers or trends
Choose PLS-DA when:
- Your study involves predefined groups
- You're aiming to find discriminative biomarkers
- You need to predict group membership for new samples
Best Practice Tip: Start with PCA for exploratory assessment. If group separation appears promising, move on to PLS-DA for deeper classification and variable importance analysis.
Evaluating PLS-DA Models: Preventing Overfitting
Although PLS-DA can effectively classify samples, it is also susceptible to overfitting, especially in high-dimensional omics datasets. Ensuring the model's validity is critical for drawing reliable biological conclusions. The following techniques can help assess and improve model robustness:
To ensure your PLS-DA model is robust and reliable:
- Use cross-validation to evaluate model performance (metrics: R2Y and Q2Y)
- Perform permutation tests to assess statistical significance
- Monitor the gap between R2Y and Q2Y—large differences may indicate overfitting
 and Permutation Frequency Distribution_1748333233_WNo_484d437.webp)
Model Validation Metrics (R²Y, Q²) and Permutation Frequency Distribution
Model Validation Metrics:
Q² (Predictive Ability): Q² quantifies the model’s predictive performance, where higher values indicate stronger predictive capability. A Q² > 0.5 is classified as a valid model, while Q² > 0.9 signifies an outstanding model.
R²X and R²Y: R²X represents the explained variance of the predictor matrix (X), and R²Y denotes the explained variance of the response matrix (Y). Values closer to 1 for both metrics reflect greater model reliability.
Axes Labels:
X-axis: Combined R²Y and Q² values. Proximity to 1 indicates robust model performance.
Y-axis: Frequency distribution of classification accuracy observed across 200 permutation experiments.

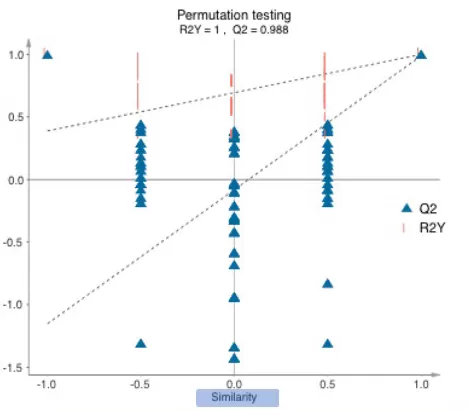
Permutation Test Analysis of OPLS-DA Model Stability
X-axis: Permutation retention, defined as the proportion of the original Y-variable order preserved during permutation testing. A retention value of 1 corresponds to the original model’s R²Y and Q².
Y-axis: Values of R²Y or Q² derived from the permutation tests.
Regression Trends: Dashed lines depict the linear regression trends for R²Y (blue) and Q² (red), illustrating their relationship with permutation retention.
Summary
PCA and PLS-DA are powerful tools for multivariate analysis in omics research. PCA offers unbiased insight into data structure, making it ideal for initial exploration. PLS-DA, on the other hand, leverages supervised learning to enhance group separation and support biomarker discovery. Understanding when and how to use each method can greatly improve the accuracy and impact of your analysis. Understanding when and how to use each method can greatly improve the accuracy and impact of your analysis.
To further explore supervised methods, check out our comprehensive comparison of PCA, PLS-DA, and OPLS-DA.
FAQ
What is the main difference between PCA and PLS-DA?
PCA is an unsupervised method focusing on capturing overall data variance, while PLS-DA is supervised and aims to separate predefined sample groups.
When should I choose PLS-DA over PCA?
Choose PLS-DA when your analysis requires classification or you aim to discover biomarkers that differentiate between groups.
Is PLS-DA more prone to overfitting than PCA?
Yes. Because PLS-DA uses group labels, it carries a higher risk of overfitting and should always be validated with techniques such as cross-validation and permutation testing.
What are VIP scores in PLS-DA?
VIP (Variable Importance in Projection) scores indicate the influence of each variable in separating sample groups, and are commonly used for identifying potential biomarkers.
Can PCA and PLS-DA be used together?
Absolutely. PCA is typically used first to assess data quality and distribution, followed by PLS-DA for supervised classification and deeper analysis.
Is PLS-DA better than PCA?
Not necessarily. PCA is best suited for exploring data structure without prior assumptions, while PLS-DA is more effective when classification or biomarker identification is the goal. Both methods are complementary rather than mutually exclusive.
Read more
- Understanding WGCNA Analysis in Publications
- Deciphering PCA: Unveiling Multivariate Insights in Omics Data Analysis
- Metabolomic Analyses: Comparison of PCA, PLS-DA and OPLS-DA
- WGCNA Explained: Everything You Need to Know
- Harnessing the Power of WGCNA Analysis in Multi-Omics Data
- Beginner for KEGG Pathway Analysis: The Complete Guide
- GSEA Enrichment Analysis: A Quick Guide to Understanding and Applying Gene Set Enrichment Analysis
- Comparative Analysis of Venn Diagrams and UpSetR in Omics Data Visualization
Next-Generation Omics Solutions:
Proteomics & Metabolomics
Ready to get started? Submit your inquiry or contact us at support-global@metwarebio.com.


