
PLS-DA in Metabolomics: Principles, Workflow, Interpretation, and Best Practices
In metabolomics, lipidomics, proteomics, and other omics workflows, researchers often face the classic small-n, large-p problem: dozens of samples, thousands of variables, and dense correlation structures. Under those conditions, standard univariate testing or unsupervised ordination alone rarely gives a stable view of class-related biology. Partial Least Squares Discriminant Analysis (PLS-DA) became popular because it performs dimensionality reduction and supervised classification at the same time, helping teams visualize class separation, prioritize candidate biomarkers, and build preliminary predictive models from noisy high-dimensional data. This article provides a practical and research-focused guide to PLS-DA, covering its core principles, analytical workflow, result interpretation, common pitfalls, and best practices for robust biomarker discovery in metabolomics and multi-omics studies.
What Is PLS-DA and Why Is It Used in Metabolomics?
Omics datasets are usually high-dimensional, strongly collinear, and biologically noisy. In metabolomics, many measured features belong to connected pathways, so variables often move together rather than independently. That is exactly the setting in which latent-variable methods become attractive: they compress correlated variables into a smaller number of components while preserving information relevant to the biological question (Anwardeen et al., 2023; Xu and Goodacre, 2025).
PLS-DA is essentially a supervised extension of partial least squares regression. Instead of looking only for directions of maximum overall variance, as PCA does, PLS-DA uses class information during model construction and searches for latent variables that best separate predefined groups. Its continued popularity in metabolomics is not only statistical but also practical: it is built into widely used software environments and sits naturally inside standard bioinformatics workflows for quality control, classification, and biomarker prioritization (Chen et al., 2022; Anwardeen et al., 2023). (Learn more at: PCA vs PLS-DA vs OPLS-DA)
What Can PLS-DA Do in Metabolomics Analysis?
PLS-DA is not just a prettier score plot. In real metabolomics data analysis, it is valuable because it links supervised class separation with feature prioritization, making it useful for both discovery-stage biomarker work and early predictive modeling (Chen et al., 2022; Anwardeen et al., 2023).
Its main value usually falls into three practical areas:
- Dimensionality reduction and visualization. PLS-DA compresses hundreds or thousands of variables into a few latent components, allowing researchers to inspect whether disease vs. control, responder vs. non-responder, or treated vs. untreated samples show meaningful separation in a two- or three-dimensional space.
- Biomarker discovery and feature prioritization. By combining score patterns, loading structure, and VIP values, PLS-DA helps identify the metabolites, lipids, peptides, or spectral features that contribute most strongly to class discrimination.
- Predictive classification of unknown samples. Once a model has been built and validated appropriately, it can be used to estimate which class a new sample is most likely to belong to, although such claims should always be supported by rigorous cross-validation and, ideally, external validation.
PLS-DA Workflow for Metabolomics Data Analysis
A good PLS-DA analysis starts long before the model is fitted. In practice, the robustness of the result is determined by three upstream decisions: whether the raw data were processed properly, whether the study design supports supervised modeling, and whether validation was planned before looking at the score plot (Chen et al., 2022; Sun and Xia, 2023; Xu and Goodacre, 2025).
1) Step 1: Prepare the Input Matrix and Sample Metadata.
Use a sample-by-variable table in which rows are biological samples and columns are quantified features. At minimum, the metadata should include sample ID and group label; in a serious project, batch, run order, and QC status should also be retained. PLS-DA requires predefined classes, so at least two groups are necessary. Binary designs are usually easiest to interpret, while multi-class designs are possible but more fragile. There is no universal post-2021 minimum sample-size rule, but as a practical inference from the repeated literature warnings about high dimensionality and limited sample size, models built on fewer than about five biological replicates per class should be treated as exploratory only, whereas ten or more per class is a more defensible starting point for discovery-stage work rather than a formal consensus cutoff (Anwardeen et al., 2023; Xu and Goodacre, 2025).

Example of sample-by-variable table
2) Step 2: Preprocess and Scale the Data Properly.
Features with excessive missingness should usually be removed rather than rescued mechanically. Zero values should be interpreted carefully, because they may represent true absence, signal below the detection limit, or preprocessing artifacts. In untargeted LC-MS metabolomics, a small-value replacement strategy can be acceptable for sparse non-detects, but widespread missingness is usually a sign that the feature is unstable. Log transformation is often advisable when intensity distributions are strongly right-skewed, because it stabilizes variance and reduces the dominance of extreme values. Mean-centering is standard. For scaling, Pareto scaling is often a sensible default in discovery-oriented metabolomics because it reduces the influence of very abundant metabolites without flattening variance as aggressively as unit-variance scaling; however, the best choice depends on the study objective and data structure (Sun and Xia, 2023).

Simplified workflow of the statistical steps in metabolomics
Image reproduced from Anwardeen et al., 2023, BMC bioinformatics, licensed under the Creative Commons Attribution 4.0 International License (CC BY 4.0).
3) Step 3: Build and Validate the PLS-DA Model
Choose the number of latent variables by cross-validation, not by whichever model gives the prettiest separation. Report R² and Q², but do not treat high values alone as proof of biological truth. In a publishable PLS-DA workflow, repeated cross-validation and permutation testing are not optional extras; they are central safeguards against overfitting, especially in small cohorts (Xu and Goodacre, 2025).
4) Step 4: Interpret the Model in a Biological Context.
Once the model is stable, extract scores, loadings, VIP values, and class predictions, then combine them with fold change, adjusted univariate statistics, and metabolite annotation confidence. PLS-DA should narrow the candidate space and support prioritization, not replace biochemical reasoning, orthogonal assays, or pathway-level interpretation (Chen et al., 2022; Anwardeen et al., 2023).
How to Interpret PLS-DA Results
PLS-DA figures are useful only when interpreted together. A score plot tells you how samples behave, a loading or VIP view tells you which variables drive that behavior, and model-validation metrics tell you whether the apparent separation is trustworthy. Reading any one of these in isolation is one of the most common sources of over-interpretation in metabolomics papers (Anwardeen et al., 2023; Xu and Goodacre, 2025).
Score Plot: Evaluate Sample Separation Patterns
In a score plot, each point is a sample. The first question is not whether the groups are far apart, but whether biological replicates cluster sensibly and whether outliers are driving the pattern. If your software draws a 95% Hotelling’s T² ellipse, use it mainly as an outlier-screening aid. Strong visual separation can be biologically meaningful, but it is not a statistical conclusion on its own. A score plot should always be read together with cross-validation and permutation results, because a model can separate classes cleanly and still be overfit (Xu and Goodacre, 2025).

PLS-DA Score Plot
Loading Plot: Identify Variables Driving Separation
In a loading plot, each point represents a variable rather than a sample. Variables far from the origin contribute more strongly to the latent component, while those close to the origin contribute less. The sign of the loading matters, but its interpretation depends on how the class labels were encoded. In practice, a loadings plot is most useful for understanding directional contribution, not for making a final biomarker call by itself.
VIP Scores: Prioritize Key Discriminatory Features
VIP, or Variable Importance in Projection, summarizes how strongly each variable contributes across the predictive components of the model. In metabolomics, VIP > 1 is widely used as a practical threshold for candidate-variable prioritization, but it should be treated as a screening rule rather than a biological law. A metabolite with VIP > 1 should still be checked against fold change, adjusted p-value, annotation quality, and pathway plausibility before it is promoted as a candidate biomarker (Anwardeen et al., 2023).
Permutation Test Plot: Assess Model Robustness
A permutation test plot evaluates whether the observed class separation is stronger than would be expected from random label assignment. In the histogram-style plot, the distributions of permuted R²Y and Q² represent model performance under repeated random reshuffling of class labels, while the original model is marked separately for comparison. A reliable PLS-DA model should show original R²Y and especially Q² values clearly shifted to the right of the permuted distributions, ideally with significant permutation p values. In the example shown here, the original model has R²Y = 1 and Q² = 0.988, both exceeding the values obtained from the permuted models, indicating that the discrimination is unlikely to be explained by chance alone. Among these metrics, Q² is generally the more important indicator of model robustness and overfitting risk.

PLS-DA Permutation Test Plot
Common PLS-DA Pitfalls and Best Practices
Because PLS-DA is supervised, it is unusually good at finding apparent structure, which is exactly why it must be handled carefully. Recent open-access reviews emphasize that irreproducibility in metabolomics often comes not from the algorithm alone, but from upstream preprocessing, data leakage, weak validation design, and over-interpretation of supervised plots (Xu and Goodacre, 2025; Sun and Xia, 2023; Anwardeen et al., 2023).)
A practical way to think about best practice is this: PLS-DA should be the middle of the workflow, not the beginning and not the end. It should come after QC, filtering, and carefully chosen preprocessing, and it should feed into validation, biomarker refinement, and pathway interpretation. In other words, a good PLS-DA analysis is less about making the plot look cleaner and more about ensuring that the class-related signal survives reasonable analytical stress tests (Chen et al., 2022; Xu and Goodacre, 2025).
|
Pitfall |
Why it causes trouble |
Better practice |
|
Running PLS-DA before checking QC, batch drift, or outliers |
The model may separate technical artifacts rather than biology |
Use PCA/QC review first, then correct or model batch effects before supervised analysis |
|
Choosing the model because the score plot looks “nicely separated” |
Visual separation alone does not prove predictive validity |
Report cross-validation, permutation testing, and component-selection logic |
|
Treating VIP > 1 as sufficient evidence for a biomarker |
Important features in the model may still be unstable, confounded, or poorly annotated |
Combine VIP with fold change, FDR-controlled univariate testing, and identification confidence |
|
Ignoring class imbalance, confounders, or external validation |
Apparent performance may collapse in a new cohort |
Preserve metadata, test confounding structure, and validate in an independent set when possible |
Applications of PLS-DA in Multi-Omics Research
In modern biomedical research, PLS-DA is rarely most valuable as a standalone endpoint. Its real strength appears when it is integrated into a broader systems-biology workflow, where class-discriminating metabolites are connected to upstream transcripts, proteins, enzymes, pathways, and clinical phenotypes. Recent OA reviews consistently argue that multi-omics integration reduces false positives, reduces false negatives, and improves biological interpretability compared with metabolomics alone (Go et al., 2024; Sanches et al., 2024; Chen et al., 2022).
Integrating Metabolomics and Transcriptomics
A common strategy is to use PLS-DA to identify the metabolic features that separate phenotypes and then map those features onto transcriptomic changes in the relevant pathways. This makes the analysis more mechanistic. Instead of reporting that a metabolite panel distinguishes two disease states, researchers can ask whether those same changes are supported by altered gene expression in transporters, enzymes, or regulatory nodes tied to the same metabolic network (Sanches et al., 2024).
Integrating Metabolomics and Proteomics
Proteomics sits closer to enzymatic function than transcriptomics, so combining proteomics with metabolomics can strengthen causal interpretation. In biomarker discovery and drug development, this can be especially useful for understanding whether a metabolite shift reflects pathway activation, enzyme abundance, adaptive stress response, or off-target toxicity. Reviews of multi-omics integration emphasize that such combinations can uncover patterns that single-omics analyses would miss and improve the biological credibility of candidate markers (Sanches et al., 2024; Go et al., 2024).
Clinical Stratification and Translational Research
Recent cancer-metabolomics reviews show that PLS-DA, Random Forest, and related supervised models are being used for tumor subtyping, biomarker discovery, and prognostic modeling. For translational teams, PLS-DA remains especially attractive when interpretability matters and when the goal is to move from a very large feature space toward a biologically reviewable shortlist. In practice, that makes it well suited to early-stage stratification tasks such as responder vs. non-responder analysis, toxicity phenotyping, or disease-stage separation before targeted validation is designed (Elguoshy et al., 2025).
PLS-DA vs Other Supervised Methods
Method selection should follow the biological question, not software habit. PLS-DA is useful because it is interpretable, familiar to many omics researchers, and naturally aligned with biomarker prioritization, but it is not the only option. In practice, the right comparison is not “which method is best in general,” but “which method gives the most reliable answer for this dataset and this study objective” (Anwardeen et al., 2023; Xu and Goodacre, 2025).
PLS-DA vs OPLS-DA
OPLS-DA is often described as a more interpretable refinement of PLS-DA. The basic idea is that it separates variation that is predictive of class membership from variation that is orthogonal to it. That can make score interpretation, loadings, and biomarker-prioritization plots cleaner and easier to explain. However, OPLS-DA does not solve the validation problem. If the study is underpowered or the preprocessing is weak, OPLS-DA can still overfit just as convincingly as PLS-DA. Use it when interpretability improves, but apply exactly the same rigor in cross-validation and permutation testing (Anwardeen et al., 2023; Xu and Goodacre, 2025).
PLS-DA vs PCA
PCA is unsupervised; PLS-DA is supervised. That distinction matters. PCA is excellent for first-pass exploration, outlier detection, QC clustering, and checking whether technical effects dominate the data. PLS-DA, by contrast, deliberately uses class labels and is therefore more sensitive to group-related structure. In a rigorous omics workflow, PCA should usually come first and PLS-DA second. If PCA already shows severe batch drift or unstable QC behavior, moving directly to PLS-DA is usually a mistake (Chen et al., 2022; Anwardeen et al., 2023).
PLS-DA vs Random Forest and SVM
PLS-DA remains attractive when you want a linear, latent-variable model that handles collinearity well and offers interpretable outputs such as scores, loadings, and VIP rankings. Random Forest is often more flexible for nonlinear interactions, is robust in the presence of class imbalance, and is less sensitive to scaling choices. SVM can be powerful when class boundaries are nonlinear and subtle, but it usually needs more careful hyperparameter tuning and is less transparent biologically. For many metabolomics and drug-discovery teams, the most practical strategy is not to choose only one method: use PLS-DA as the main interpretation engine, then compare it against Random Forest or SVM as a sensitivity check on classification stability (Anwardeen et al., 2023; Elguoshy et al., 2025).
Conclusion and Practical Tools for PLS-DA Analysis
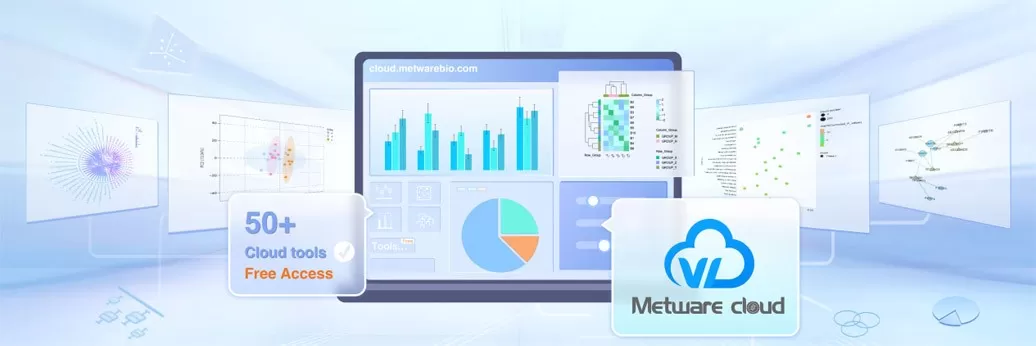
PLS-DA remains one of the most practical supervised methods for metabolomics data analysis because it matches the statistical geometry of omics data: many variables, limited samples, and substantial collinearity. Used properly, it is highly effective for class visualization, candidate-biomarker prioritization, and early predictive modeling. For researchers who need a faster and more accessible way to perform PLS-DA, the Metware Cloud Platform provides a practical one-click cloud tool for streamlined analysis. Supported by an experienced multi-omics bioinformatics team, the platform offers free registration, accepts user-uploaded data in the required format, and includes more than 50 omics data analysis tools with clear text guidance and video tutorials.
In the PLS-DA analysis panel, users only need to upload a sample quantitative matrix and a sample grouping file, then choose the required preprocessing parameters, the platform automatically generates a downloadable result package containing the completed PLS-DA outputs. With its intuitive interface and straightforward workflow, this tool is well suited for researchers who want efficient and reliable PLS-DA analysis without programming.
References:
1. Anwardeen, N. R., Diboun, I., Mokrab, Y., Althani, A. A., & Elrayess, M. A. (2023). Statistical methods and resources for biomarker discovery using metabolomics. BMC bioinformatics, 24(1), 250. https://doi.org/10.1186/s12859-023-05383-0
2. Chen, Y., Li, E. M., & Xu, L. Y. (2022). Guide to Metabolomics Analysis: A Bioinformatics Workflow. Metabolites, 12(4), 357. https://doi.org/10.3390/metabo12040357
3. Xu, Y., Goodacre, R. (2025) Mind your Ps and Qs – Caveats in metabolomics data analysis. TrAC Trends in Analytical Chemistry 183, 118064. https://doi.org/10.1016/j.trac.2024.118064
4. Elguoshy, A., Zedan, H., & Saito, S. (2025). Machine Learning-Driven Insights in Cancer Metabolomics: From Subtyping to Biomarker Discovery and Prognostic Modeling. Metabolites, 15(8), 514. https://doi.org/10.3390/metabo15080514
5. Go, D., Yeon, G. H., Park, S. J., Lee, Y., Koh, H. G., Koo, H., Kim, K. H., Jin, Y. S., Sung, B. H., & Kim, J. (2024). Integration of metabolomics and other omics: from microbes to microbiome. Applied microbiology and biotechnology, 108(1), 538. https://doi.org/10.1007/s00253-024-13384-z
6. Sanches, P. H. G., de Melo, N. C., Porcari, A. M., & de Carvalho, L. M. (2024). Integrating Molecular Perspectives: Strategies for Comprehensive Multi-Omics Integrative Data Analysis and Machine Learning Applications in Transcriptomics, Proteomics, and Metabolomics. Biology, 13(11), 848. https://doi.org/10.3390/biology13110848
7. Sun, J., & Xia, Y. (2023). Pretreating and normalizing metabolomics data for statistical analysis. Genes & diseases, 11(3), 100979. https://doi.org/10.1016/j.gendis.2023.04.018
Next-Generation Omics Solutions:
Proteomics & Metabolomics
Ready to get started? Submit your inquiry or contact us at support-global@metwarebio.com.
