t-SNE vs UMAP: A Comprehensive Guide for Visualizing High-Dimensional Omics Data
Dimensionality reduction is a fundamental technique used in the analysis of complex omics data. By projecting high-dimensional data into a lower-dimensional space, researchers can more easily visualize intricate patterns, such as clustering, gradients, and rare populations, which are often difficult to detect in high-dimensional datasets. This approach is crucial for analyzing single-cell RNA sequencing (scRNA-seq), multi-omics, and other high-dimensional biological data types, allowing scientists to reveal underlying biological structures and relationships. Among the most widely used techniques for dimensionality reduction in biological research are t-SNE and UMAP.
What Is t-SNE and How It Works
T-distributed Stochastic Neighbor Embedding (t-SNE) is a widely used nonlinear dimensionality reduction technique in bioinformatics, particularly for visualizing complex high-dimensional omics data like single-cell RNA sequencing (scRNA-seq) and multi-omics. t-SNE works by modeling pairwise neighborhood probabilities in high-dimensional space and finding a low-dimensional embedding that minimizes Kullback–Leibler (KL) divergence between the original and embedded distributions. This ensures that closely related data points stay near each other in the low-dimensional space, forming distinct clusters.
While t-SNE excels at preserving local structures, it does not maintain global distances, making it ideal for identifying fine-grained patterns, such as rare cell populations or subtle biological clusters. However, the method is sensitive to hyperparameters like perplexity, learning rate, and random initialization, which require careful tuning for optimal results.
Key Characteristics:
- Nonlinear Embedding: t-SNE focuses on local neighborhood relationships, making it effective for visualizing complex, nonlinear patterns in omics data.
- Sensitive to Parameters: t-SNE’s performance heavily depends on tuning hyperparameters, such as perplexity and learning rate, to ensure meaningful embeddings.
- Best After PCA: t-SNE works best when preceded by PCA for initial dimensionality reduction, reducing noise and complexity in high-dimensional data.
- Cosine/Correlation Metrics: For omics data, using cosine or correlation metrics is preferred over Euclidean distance to better capture biological relationships.
- FIt-SNE for Large Datasets: For large datasets, FIt-SNE (Fast Fourier Transform-accelerated t-SNE) accelerates the process, improving t-SNE's scalability and efficiency.
What Is UMAP and Its Advantages
U Uniform Manifold Approximation and Projection (UMAP) is a powerful manifold learning technique for dimensionality reduction in omics data analysis. It constructs a weighted k-nearest neighbor (kNN) graph—a fuzzy simplicial set—and then optimizes the low-dimensional layout by minimizing cross-entropy. Unlike t-SNE, which focuses primarily on local structure, UMAP strikes a balance between preserving local structures and providing better global organization, making it particularly effective for visualizing large, complex datasets such as single-cell RNA sequencing (scRNA-seq) and multi-omics data.
UMAP excels in handling large-scale datasets, providing scalable and stable embeddings, and it can also be applied incrementally to new samples. Additionally, UMAP allows flexible control over the local/global trade-off and cluster tightness/continuity, enabling fine-tuning of the visualization to suit specific analysis needs.
Key Advantages of UMAP:
- Balances Local and Global Structure: Unlike t-SNE, which focuses mainly on preserving local structures, UMAP maintains both local relationships and a clear global organization of the data, making it easier to interpret large-scale patterns.
- Efficient Scaling: UMAP scales efficiently to large datasets via NN-Descent, a technique that accelerates the nearest neighbor search. It also supports incremental transformations, making it suitable for continuous data analysis.
- Flexible Control: UMAP allows users to adjust the local/global trade-off and cluster tightness/continuity, giving greater flexibility in fine-tuning visualizations to highlight important biological relationships.
- Robust for Continuous Trajectories: UMAP is particularly strong at visualizing continuous trajectories in biological data, such as cell differentiation or temporal changes, and works well in the analysis of large-scale single-cell data.
Key Differences Between t-SNE and UMAP
One of the main differences between t-SNE and UMAP lies in their focus on structural preservation. While t-SNE primarily emphasizes local structure—preserving the nearest neighbor relationships and creating tight clusters—UMAP enhances both local and global structures. UMAP not only retains the close relationships between similar data points but also provides a clearer organization of the entire dataset, making it easier to interpret large-scale biological data. This makes UMAP especially advantageous in cases where a broader understanding of the data’s global relationships, such as trends or continuous trajectories, is important for the analysis of complex biological systems.
t-SNE vs UMAP: Key Difference in Their Methods and Performance
|
Aspect |
t-SNE |
UMAP |
|
Objective |
Minimize KL divergence of neighbor probabilities |
Minimize cross-entropy of fuzzy kNN graph |
|
Focus |
Strong local structure preservation |
Balances local and global structure |
|
Hyper-parameters |
Perplexity, learning rate, number of iterations |
Number of neighbors, minimum distance |
|
Stability |
Sensitive to seeds/learning rate |
Generally more stable and reproducible |
|
Global distances |
Not meaningful |
More interpretable |
|
Scale/Speed |
Computationally intensive |
Good scalability via NN-Descent |
|
Continuous manifolds |
May fragment |
Often smoother trajectories |
|
New data mapping |
Limited |
Native transform for new samples |
Application Scenarios in Single-Cell and Multi-Omics
t-SNE and UMAP are powerful dimensionality reduction techniques that are widely used across various fields of omics research. These methods help transform complex, high-dimensional biological data into intuitive, lower-dimensional visualizations, allowing researchers to identify patterns, clusters, and relationships within datasets. Whether analyzing single-cell data, bulk transcriptomics, spatial omics, or large-scale multi-omics studies, both t-SNE and UMAP offer valuable insights into the underlying biology. Below are four key application areas where these methods play a crucial role:
1. Single-Cell Omics (e.g., scRNA-seq)
t-SNE and UMAP are widely used for visualizing complex single-cell RNA sequencing (scRNA-seq) data. These techniques help reduce high-dimensional single-cell data into 2D or 3D visualizations, allowing researchers to display critical biological features such as cell clusters, lineages, and rare populations. By clustering cells based on their gene expression profiles, both t-SNE and UMAP facilitate the identification of novel cell types, differentiation pathways, and cellular responses to various treatments or conditions.
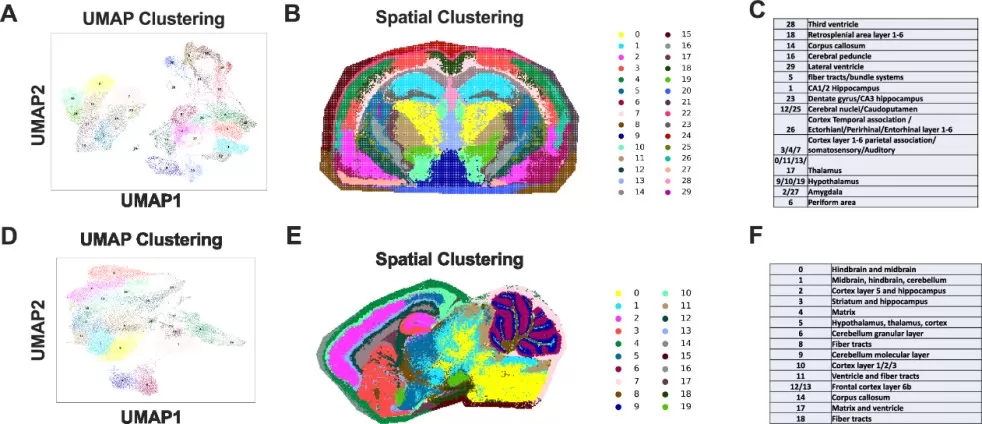
For example, in the study by Vailati Riboni et al. (2022), UMAP was used to analyze single-cell RNA sequencing data of mouse brain tissue to investigate the impact of dietary fiber on age-related microglial dysfunction. By reducing the high-dimensional gene expression data to 2D, UMAP enabled the identification of distinct microglial subpopulations, highlighting changes in gene expression related to aging and dietary fiber intake. This allowed for the visualization of microglial heterogeneity and the detection of subtle cellular responses, such as inflammation and tissue repair, which are crucial for understanding brain homeostasis and neuroinflammation.
 visualization of cell clusters identified during scRNA-seq analysis of mouse whole brain tissue_1762135712_WNo_644d492.webp)
Uniform Manifold Approximation and Projection (UMAP) visualization of cell clusters identified during scRNA-seq analysis of mouse whole brain tissue. (image source: Vailati-Riboni M. et al., Front Nutr. 2022; 9: 835824.)
2. Bulk Omics (e.g., Transcriptomics)
In bulk omics, such as transcriptomics, t-SNE and UMAP generate 2D maps that help reveal sample group separation, gene expression gradients, and the presence of outliers. By reducing the high-dimensional transcriptomic data to a lower dimension, these visualizations make it easier to understand relationships between different biological conditions or treatment groups. UMAP is particularly advantageous for identifying batch effects, distinguishing pre-defined biological groups, and uncovering in-depth clusters within the data. Its ability to reveal subtle patterns in large transcriptomic datasets is an essential tool for researchers aiming to explore the molecular basis of diseases or treatment responses.
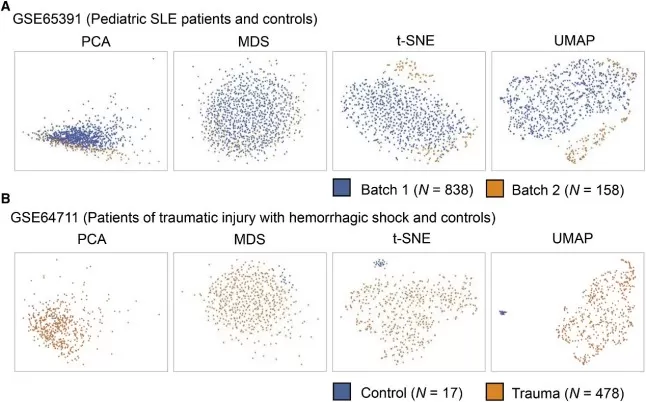
In the study by Yang et al. (2021), both t-SNE and UMAP were employed to analyze bulk transcriptomic data, focusing on the impact of batch effects and biological groupings. Figure 3 illustrates how these dimensionality reduction techniques effectively separate samples based on batch origins and biological conditions. While t-SNE is known for its ability to capture local structures, UMAP demonstrated superior performance in preserving both local and global structures, leading to clearer segregation of samples from different batches and biological groups. This ability to distinguish between technical and biological variations is crucial for accurate interpretation of transcriptomic data, highlighting the importance of choosing appropriate dimensionality reduction methods in bulk omics studies.

Biological explanation of clustering by batch effects and biological group using four different methods: PCA, MDS, t-SNE, and UMAP. (image source: Yang Y. et al., Cell Rep. 2021;36(4):109442.)
3. Spatial Omics (e.g., Spatial Metabolomics)
Spatial omics approaches, such as spatial metabolomics, rely on dimensionality reduction techniques like UMAP and t-SNE to visualize tissue architecture and metabolic gradients within biological samples. These techniques reduce the complexity of high-dimensional spectral profiles into two or three-dimensional representations, providing researchers with an intuitive way to explore the spatial distribution of molecules within tissues.
For instance, UMAP can be used to visualize different tissue structures and reveal spatially distinct metabolic gradients. By embedding the data into lower-dimensional space, researchers can better understand the interactions between cells and metabolites within specific tissue regions, which is crucial for studies in tumor microenvironments, disease progression, and treatment response. In the study by Sun et al. (2025), UMAP was used for spatial mapping of high-dimensional data from metabolomics, lipidomics, and glycomics analyses in mouse brain tissue. The UMAP embeddings enabled the visualization of distinct molecular patterns across different brain regions, uncovering metabolic heterogeneity and region-specific alterations.

Spatial dimensionality reduction, and manual annotation in brain tissues via UMAP. (image source: Clarke H.A. et al., Nat Commun. 2025;16(1):4373.)
Interpretation Tips and Pitfalls to Avoid
When interpreting t-SNE and UMAP visualizations, there are a few key considerations to keep in mind:
- Do not over-interpret distances: Both methods distort distances in high-dimensional space; therefore, they should be used primarily to explore neighbor relationships rather than absolute distances.
- Verify batch effects: Always color your plots by batch or technical covariates to ensure that observed structures are biological, not artifacts of sample preparation or experimental conditions.
- Choose metrics wisely: For high-dimensional omics data, cosine or correlation metrics often outperform Euclidean distance, especially in the case of gene expression or other biological measurements.
- Parameter sanity checks: When using UMAP, a very small minimum distance might lead to overly compact clusters, while extreme perplexity in t-SNE can blur or fragment data structures.
Conclusion: Making the Right Choice for Your Data
For dimensionality reduction in omics data, both t-SNE and UMAP are powerful nonlinear embedding tools. If your priority is sharp local neighborhoods and presentation-ready islands, t-SNE delivers—especially with modern accelerations. If you need scalable, stable visualizations with better global coherence, smoother trajectories, and the ability to map new samples, UMAP is typically the better default.
In practice, using PCA initialization, cosine/correlation metrics, and running both methods with small parameter grids is recommended. Always choose the embedding that best reflects known biology and validates against batch and external labels. By carefully selecting the right technique, you can ensure your data is visualized in a way that is both insightful and reproducible.
Reference:
1. Vailati-Riboni M, Rund L, Caetano-Silva ME, et al. Dietary Fiber as a Counterbalance to Age-Related Microglial Cell Dysfunction. Front Nutr. 2022;9:835824. Published 2022 Mar 14. doi:10.3389/fnut.2022.835824
2. Yang Y, Sun H, Zhang Y, et al. Dimensionality reduction by UMAP reinforces sample heterogeneity analysis in bulk transcriptomic data. Cell Rep. 2021;36(4):109442. doi:10.1016/j.celrep.2021.109442
3. Clarke HA, Ma X, Shedlock CJ, et al. Spatial mapping of the brain metabolome lipidome and glycome. Nat Commun. 2025;16(1):4373. Published 2025 May 12. doi:10.1038/s41467-025-59487-7
Read more:
- Multi-Omics Association Analysis Series
- Omics Data Processing Series
- Omics Data Analysis Series
- Metabolomics Batch Effects
- Understanding WGCNA Analysis in Publications
- Deciphering PCA: Unveiling Multivariate Insights in Omics Data Analysis
- Metabolomic Analyses: Comparison of PCA, PLS-DA and OPLS-DA
- WGCNA Explained: Everything You Need to Know
- Harnessing the Power of WGCNA Analysis in Multi-Omics Data
- Beginner for KEGG Pathway Analysis: The Complete Guide
Next-Generation Omics Solutions:
Proteomics & Metabolomics
Ready to get started? Submit your inquiry or contact us at support-global@metwarebio.com.


