Spatial Transcriptomics Service
What Is Spatial Transcriptomics?
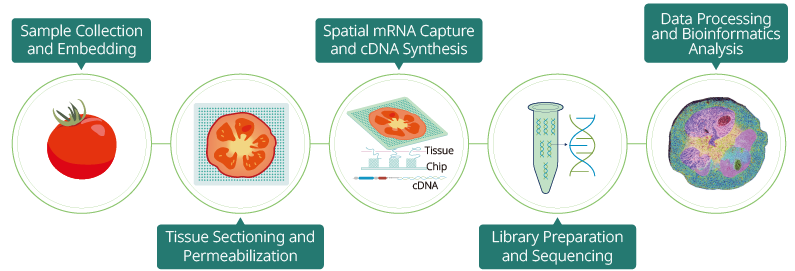
Technical Mechanism for Stereo-seq Spatial Transcriptomics
Why Choose MetwareBio for Spatial Transcriptomics Service?
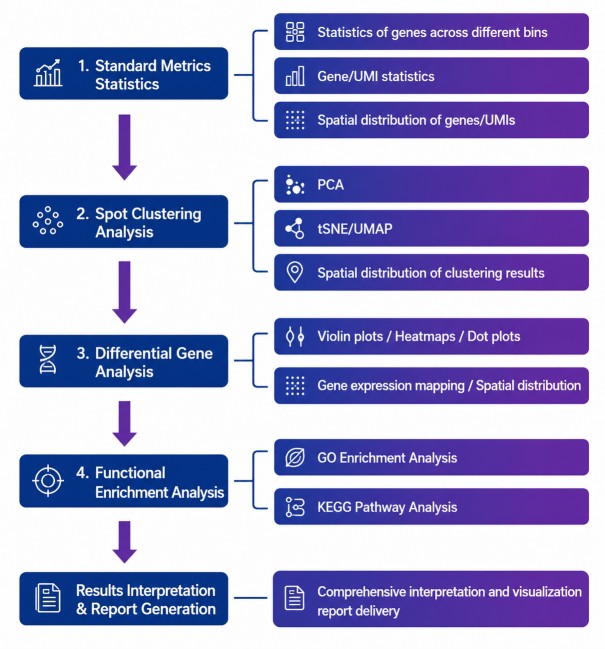
Spatial Transcriptomics Data Analysis and Deliverables
MetwareBio provides complete spatial transcriptomics data deliverables with a structured bioinformatics workflow from raw sequencing data to biological interpretation. Standard analysis includes sequencing data quality control, STAR alignment, image registration, spatial gene expression matrix generation using the SAW pipeline, dimensionality reduction and clustering, spatial expression visualization, marker gene identification, differential gene analysis, and functional enrichment. When matched single-cell RNA-seq data are available, advanced integrative analysis can further support spatial cell-type annotation, cell-type distribution analysis, spatial trajectory inference, cell–cell communication, spatial gene co-localization, pathway activity analysis, WGCNA, and copy-number variation analysis, enabling deeper interpretation of cellular heterogeneity and spatial molecular organization. Contact Us for Demo
Our Experience & Proven Track Record
| Sample Type | Median Genes per Bin200 (100 μm) |
| Mouse Ovary | 12230 |
| Mouse Large Intestine | 11208 |
| Mouse Small Intestine | 11343 |
| Mouse Spleen | 8878 |
| Mouse Kidney | 9960 |
| Mouse Liver | 11080 |
| Mouse Thymus | 11154 |
| Mouse Uterus | 10550 |
| Mouse Brain | 7814 |
| Mouse Lymph Node | 10057 |
| Mouse Testis | 12290 |
| Mouse Eye | 9769 |
| Mouse Lung | 10980 |
| Mouse Skin | 10391 |
| Mouse Colon | 10184 |
| Sample Type | Median Genes per Bin200 (100 μm) |
| Wheat Stem | 19182 |
| Cotton Shoot Apex | 18486 |
| Rice Young Panicle | 9325 |
| Rice Stem | 9323 |
| Rice Embryo | 8952 |
| Rice Caryopsis | 7091 |
| Soybean Root Nodule | 5230 |
| Tomato Fruit | 2062 |
Key Applications of Spatial Transcriptomics
Spatial transcriptomics reveals how gene expression varies across intact tissue regions, helping define spatial domains, molecular niches, and region-specific transcriptional programs. This approach is valuable for resolving tissue heterogeneity in human samples, animal models, and plant organs where spatial organization is closely linked to biological function.
Spatial gene expression profiling helps characterize how neighboring cell populations and signaling programs are organized within local microenvironments. Applications include tumor–immune interactions, inflammatory niches, tissue-specific signaling, and spatial communication patterns in both animal and plant tissues.
By linking pathological changes with their spatial transcriptional context, spatial transcriptomics supports research on cancer, neurological disorders, inflammation, infection, fibrosis, and other complex diseases. It can also reveal region-specific molecular responses to drugs, therapeutic interventions, and experimental treatments in clinical tissues and animal models.
Spatial transcriptomics enables tissue- and region-specific analysis of molecular responses to physiological and environmental stress. It supports studies of injury, regeneration, hypoxia, and metabolic stress in biomedical research, as well as drought, salinity, temperature, nutrient limitation, pathogen challenge, and agronomic trait variation in plant research.
Spatial Transcriptomics Case Studies
Spatial Transcriptomics Reveals ZFP36-Mediated Immunometabolic Reprogramming in Bladder Cancer
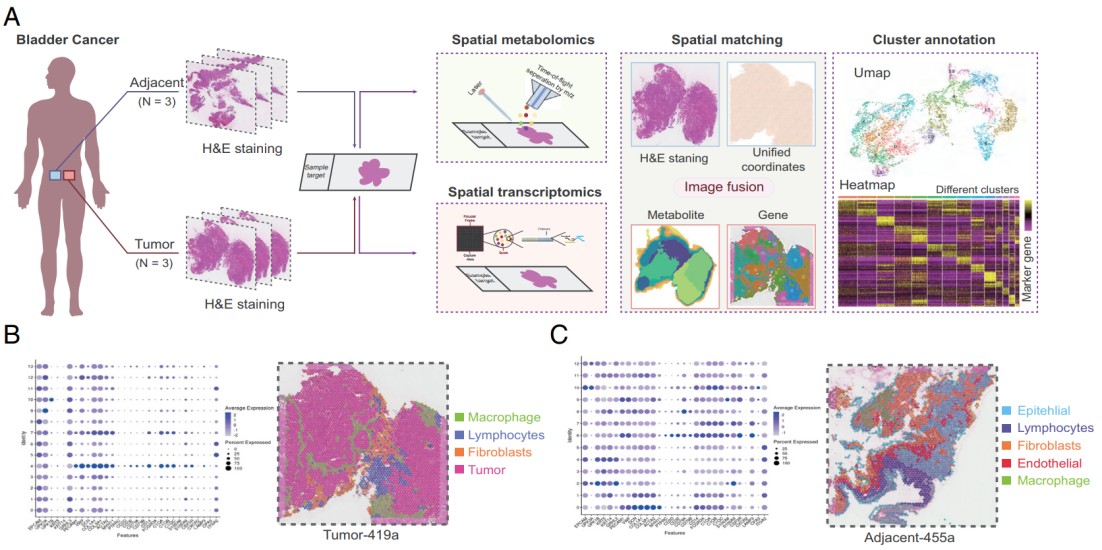
In a 2026 PNAS study, researchers investigated the spatial heterogeneity and immune–metabolic regulation of bladder cancer (BLCA) using paired tumor and adjacent normal tissues. MetwareBio’s spatial transcriptomics service enabled spatially resolved gene expression profiling, cell-population annotation, and characterization of region-specific transcriptional programs across the bladder cancer microenvironment, revealing distinct distributions of tumor cells, lymphocytes, macrophages, fibroblasts, and other cell populations. Spatial transcriptomic analysis further supported the identification of ZFP36 as a key immunoregulatory factor, with spatial expression analysis linking ZFP36 to immune-related pathways and identifying C1QBP as a potential downstream target involved in T-cell regulation. Combined with MetwareBio’s spatial metabolomics service, the integrated spatial multi-omics analysis connected localized gene expression with metabolic reprogramming in lymphocyte-rich tumor regions, helping uncover the ZFP36–C1QBP regulatory axis and providing mechanistic insights into tumor immune evasion and potential immunotherapeutic targets in bladder cancer.
Sample Preparation & Submission Guidelines
- FFPE tissue blocks
- Fresh-frozen tissue blocks embedded in OCT or FSC 22
- Available chip sizes: 0.5 × 0.5 cm, 1 × 1 cm, with custom sizes available upon request
- Tissue length: 1.5 mm ≤ length ≤ chip length
- Tissue width: 1.5 mm ≤ width ≤ chip width
- Tissue area: ≤ 80% of the chip capture area
- Tissue thickness: 2–25 mm
- FFPE tissue blocks: Store at 4 °C and ship with ice packs
- Fresh-frozen tissue blocks: Store at −80 °C and ship on dry ice
Frequently Asked Questions (FAQ)
Bulk RNA-seq measures averaged gene expression across a tissue sample, whereas spatial transcriptomics measures gene expression while preserving its original spatial location within the tissue. Spatial transcriptomics therefore adds an important spatial dimension to transcriptome analysis, enabling researchers to identify region-specific gene expression, spatial molecular heterogeneity, tissue architecture, and localized biological programs that may be masked by bulk RNA-seq.
| Feature | Bulk RNA-seq | Spatial Transcriptomics |
| Gene Expression Profiling | Average expression across the entire sample | Spatially resolved gene expression within tissue |
| Spatial Information | Not retained | Preserved |
| Tissue Heterogeneity | Signals from different regions are averaged | Regional molecular differences can be resolved |
| Spatial Resolution | Whole-sample level | Cellular to subcellular scale, depending on platform |
| Typical Applications | Differential expression, pathway analysis, transcriptome profiling | Tissue architecture, spatial heterogeneity, microenvironments, spatial interactions |
| Best Suited For | Studies focused primarily on overall transcriptional changes | Studies where the location of gene expression is biologically important |
Yes. MetwareBio provides 10x Genomics Visium HD spatial transcriptomics in addition to Stereo-seq. Our current probe-based Visium HD service is available for human and mouse tissue samples and enables high-resolution spatial gene expression profiling while preserving tissue morphology. Visium HD uses a continuous array of 2 × 2 μm spatially barcoded squares to localize gene expression signals within tissue sections.
Stereo-seq and 10x Genomics Visium HD are both sequencing-based spatial transcriptomics platforms, but they differ in RNA capture strategy, species compatibility, capture area, gene detection strategy, and native spatial resolution. Stereo-seq is particularly suitable for studies requiring broad species compatibility, large tissue coverage, and nanoscale spatial mapping, while MetwareBio’s current probe-based Visium HD workflow provides a standardized option for human and mouse spatial gene expression studies. Stereo-seq currently supports poly(A)-based capture for fresh-frozen tissues and a random-probe workflow for FFPE tissues.
| Feature | Stereo-seq | 10x Genomics Visium HD |
| Capture Strategy | Poly(A)-based capture for fresh-frozen tissues; random-probe workflow available for FFPE | Probe-based gene expression workflow |
| Species Compatibility | Broad compatibility with human, animal, and plant samples | Human and mouse in MetwareBio’s current service |
| Capture Area | 0.5 × 0.5 cm and 1 × 1 cm standard formats; customizable large-area chips upon request | 6.5 × 6.5 mm |
| Gene Detection | Transcriptome-wide profiling without a predefined gene-specific probe panel | Predefined whole-transcriptome probe panels |
| Capture Feature Size | ~220 nm DNB spot | 2 × 2 μm barcoded square |
| Highest Native Spatial Resolution | 500 nm | 2 μm |
Stereo-seq spatial transcriptomics supports both fresh-frozen and FFPE tissue samples. Fresh-frozen tissue blocks can be embedded in OCT or FSC 22 for cryosectioning, while FFPE samples can be submitted as properly prepared paraffin-embedded tissue blocks. Before spatial transcriptomics analysis, RNA quality and tissue morphology should be evaluated because sample integrity and section quality directly influence RNA capture and spatial gene expression data quality. Stereo-seq uses poly(A)-based RNA capture for fresh-frozen tissue and a random-probe strategy for its FFPE workflow.
Yes. Stereo-seq supports spatial transcriptomics analysis of plant tissues and is not limited to conventional human or mouse models. Its broad species compatibility makes it applicable to roots, stems, shoot apices, reproductive tissues, embryos, fruits, seeds, and other plant organs. Plant spatial transcriptomics can be used to investigate tissue organization, developmental regulation, environmental stress adaptation, pathogen interactions, and agriculturally important traits while preserving the spatial context of gene expression. STOmics describes its Stereo-seq transcriptomics workflows as species agnostic and applicable across animal and plant samples.
Stereo-seq provides a native nanoscale array resolution of 500 nm. The Stereo-seq array contains DNB capture features approximately 220 nm in diameter, with a 500 nm center-to-center distance between adjacent DNBs. This high-density spatial array supports cellular and subcellular spatial mapping of transcriptomic signals while maintaining broader tissue architecture. The effective biological resolution of an individual dataset can also depend on tissue morphology, RNA abundance, cell segmentation, sequencing depth, and downstream binning strategy.
The appropriate Stereo-seq chip size should be selected according to tissue dimensions and the anatomical region that needs to be captured within a continuous spatial field of view. Standard capture formats include 0.5 × 0.5 cm and 1 × 1 cm, while customized large-format arrays can be considered for larger organs, developmental specimens, or plant structures. Stereo-seq large-chip designs can extend up to 13 × 13 cm, allowing large tissue sections to be profiled without unnecessarily dividing biologically continuous regions.
Yes. Spatial transcriptomics can be integrated with single-cell RNA-seq and spatial metabolomics for multi-omics analysis of complex tissues. Matched single-cell RNA-seq data can strengthen cell-type annotation and support advanced analyses such as spatial cell-type mapping, cell–cell communication, spatial trajectory analysis, WGCNA, and inferred copy-number variation analysis. Integration with spatial metabolomics can further connect spatial gene expression patterns with localized metabolic phenotypes, providing complementary molecular information for investigating tissue heterogeneity, microenvironments, and spatial biological regulation.
Reference
Ye F, Han X, Li W, et al. Spatial multiomics profiling reveals ZFP36-mediated immunometabolic reprogramming in bladder cancer. Proc Natl Acad Sci U S A. 2026;123(15):e2505125123. doi:10.1073/pnas.2505125123