
Omics data analysis is essential for interpreting high-dimensional molecular datasets generated by metabolomics, proteomics, lipidomics, transcriptomics, and post-translational modification studies. These datasets often contain hundreds to thousands of measured features, but only a limited number of biological samples, making statistical analysis critical for reliable biological interpretation. In a typical omics report, researchers may encounter PCA plots, volcano plots, differential feature tables, PLS-DA models, and VIP scores, yet these outputs answer different analytical questions. This article explains the difference between univariate and multivariate analysis in omics, clarifies where each approach fits in an omics data analysis workflow, and shows how combining both methods can support more reliable differential feature screening, biomarker discovery, pathway interpretation, and multi-omics research.
1. WHAT IS UNIVARIATE ANALYSIS IN OMICS?
Univariate analysis in omics is a statistical approach that evaluates one molecular feature at a time. In metabolomics, proteomics, lipidomics, transcriptomics, and post-translational modification studies, this feature may be a metabolite, protein, lipid species, transcript, gene, peptide, glycan, microbial taxon, or modification site. The goal is to determine whether an individual feature shows a statistically meaningful difference between experimental groups, clinical phenotypes, time points, or treatment conditions. This makes univariate analysis especially useful for differential feature screening and molecule-level interpretation.
1.1 Common Methods Used in Univariate Omics Analysis
Common univariate methods include the Student's t-test, Welch's t-test, Wilcoxon rank-sum test, analysis of variance, and linear models. The choice of method depends on the experimental design, data distribution, sample size, and number of groups being compared. For example, t-tests are often used for two-group comparisons, while analysis of variance is commonly applied when three or more groups are involved. More complex omics study designs may require covariate-adjusted linear models, mixed-effects models, or moderated statistical frameworks. In transcriptomics and proteomics, linear model-based tools such as limma are widely used because they can stabilize variance estimation across many measured features, particularly when sample size is limited (Ritchie et al., 2015). (Related reading: T-Test vs Welch's T-Test vs Mann–Whitney U)
1.2 Common Outputs of Univariate Analysis
Univariate analysis typically produces statistical parameters that describe both the significance and magnitude of molecular differences. These outputs are often used to generate differential feature tables for metabolites, proteins, lipids, genes, or post-translational modification sites.
- p-value: Measures the statistical evidence against the null hypothesis. A smaller p-value suggests stronger evidence that a feature differs between groups, but it does not describe the magnitude of the change.
- Adjusted p-value / q-value: Corrects for multiple testing when thousands of features are analyzed simultaneously. In high-throughput omics, adjusted p-values or q-values are generally more reliable than raw p-values for selecting differential molecules. The false discovery rate framework is commonly used to control the expected proportion of false discoveries among significant results (Benjamini & Hochberg, 1995).
- Fold change: Describes the magnitude and direction of difference between groups. A fold change greater than 1 usually indicates upregulation, while a value below 1 indicates downregulation.
- Differential feature list: Summarizes features that meet predefined statistical thresholds, often based on adjusted p-value, fold change, and biological relevance.
1.3 Volcano Plot: A Common Visualization for Univariate Results
A volcano plot is one of the most common visual summaries of univariate analysis in omics data analysis. It places log2 fold change on one axis and statistical significance, often −log10 p-value or −log10 adjusted p-value, on the other. This allows differential metabolites, proteins, lipids, or genes to be screened according to both effect size and statistical evidence. However, a volcano plot remains a molecule-level summary. It can highlight individual features with strong statistical and quantitative differences, but it does not show whether samples separate globally or whether group differences arise from coordinated molecular patterns. Those questions require multivariate analysis.
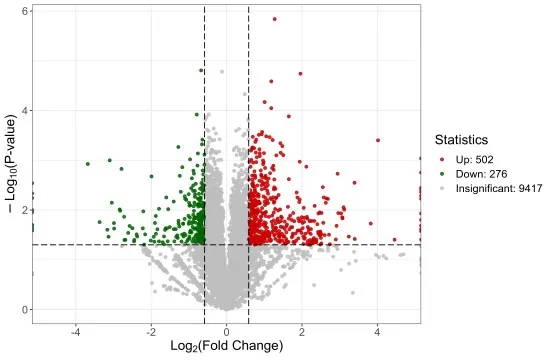
Figure 1. Volcano Plot of Differentially Expressed Proteins. Each point represents one molecular feature; the x-axis shows log2 fold change and the y-axis shows −log10 p-value, enabling simultaneous visualization of effect size and statistical significance.
2. WHAT IS MULTIVARIATE ANALYSIS IN OMICS?
Multivariate analysis in omics is a statistical approach that evaluates many molecular features simultaneously. Rather than testing one molecule at a time, it examines how groups of variables explain sample variation, group separation, correlated molecular patterns, or predictive classification. This is important because biological phenotypes are often driven by coordinated changes across metabolic pathways, protein networks, lipid remodeling processes, and gene-regulatory programs. Multivariate analysis therefore provides system-level context for omics data interpretation and helps reveal patterns that may not be obvious from individual features alone.
2.1 Common Methods Used in Multivariate Omics Analysis
Common multivariate methods include principal component analysis, hierarchical clustering, partial least squares discriminant analysis, orthogonal partial least squares discriminant analysis, random forest, support vector machines, and other machine learning models. These methods can be broadly divided into unsupervised and supervised approaches.
Principal component analysis (PCA) is one of the most widely used unsupervised multivariate methods. It transforms a large feature matrix into a smaller number of principal components that capture the dominant sources of variance in the data. PCA is commonly used to inspect sample distribution, detect outliers, identify batch effects, and assess whether biological groups show overall separation (Jolliffe & Cadima, 2016). Hierarchical clustering and heatmaps are also unsupervised tools that group samples or features according to similarity patterns.
Supervised multivariate methods, such as PLS-DA, OPLS-DA, random forest, and support vector machines, use group labels or outcome variables during model construction. These methods can help evaluate group separation, classification performance, or feature contribution, but they require careful validation to avoid overfitting, especially when the number of molecular features far exceeds the number of samples.
2.2 Common Outputs of Multivariate Analysis
Multivariate analysis generates outputs that describe sample-level patterns, feature contributions, and model performance. These outputs are often used to complement univariate differential analysis in omics reports.
- Score plot: Shows how samples are distributed in a reduced-dimensional space, such as the first two principal components in PCA or latent variables in PLS-DA.
- Loading plot: Indicates which variables contribute most strongly to the observed sample distribution or separation.
- Clustering heatmap: Visualizes similarity patterns among samples and features, often helping reveal group-level trends or molecular co-regulation.
- VIP score: Variable importance in projection scores are commonly reported in PLS-DA or OPLS-DA workflows. A high VIP score suggests that a feature contributes strongly to a supervised model, but it does not automatically mean the feature is statistically significant, biologically causal, or suitable as a biomarker.
- Model validation metrics: Cross-validation, permutation testing, classification accuracy, and related metrics are used to evaluate whether a supervised model is reliable rather than overfitted.
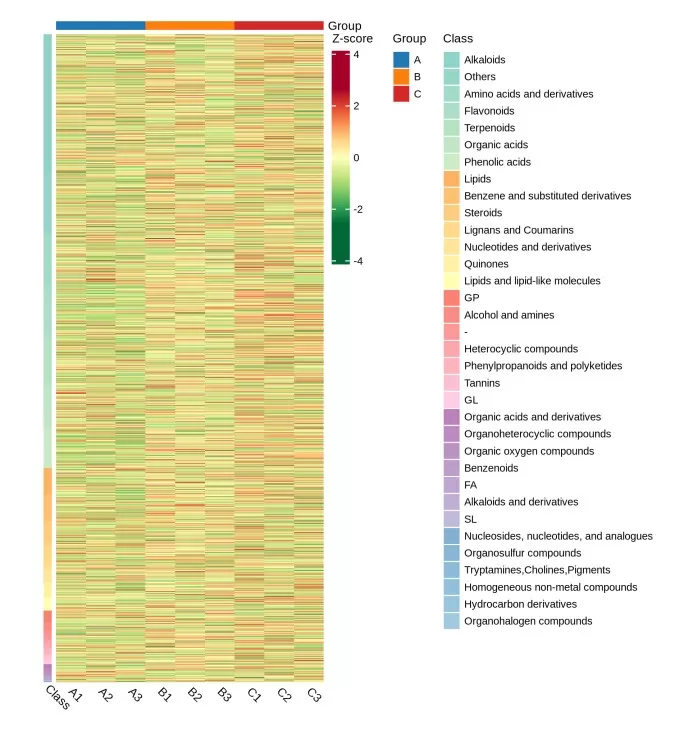
Figure 2. Clustering Heatmap of Hierarchical Cluster Analysis for Metabolomics Results. Color intensity indicates relative abundance; rows represent metabolites and columns represent samples, with dendrograms showing similarity-based grouping.
2.3 Key Considerations for Interpreting Multivariate Analysis Results
Multivariate results should be interpreted according to the type of method used. PCA and hierarchical clustering are exploratory methods because they do not use class labels during model construction. Clear separation in a PCA plot may suggest systematic differences among samples, but it does not prove that individual molecules are significantly changed.
Supervised models require more caution. PLS-DA and OPLS-DA have been widely used in metabolomics and other omics studies, but responsible interpretation requires model validation, cross-validation, and permutation testing (Gromski et al., 2015). Data preprocessing also affects multivariate analysis. Scaling, centering, transformation, missing value handling, normalization, and batch correction can change which variables dominate a PCA plot or supervised model, influencing biological interpretation and feature ranking (van den Berg et al., 2006).
3. UNIVARIATE VS MULTIVARIATE ANALYSIS IN OMICS: KEY DIFFERENCES AND COMPLEMENTARY ROLES
Univariate and multivariate analysis are sometimes presented as alternative strategies, but they provide evidence from different analytical levels. Univariate analysis gives molecule-level statistical evidence. Multivariate analysis provides system-level context by revealing global structure, sample clustering, group separation, and combined feature effects. Reliable omics interpretation usually benefits from both.
| Dimension | Univariate Analysis | Multivariate Analysis |
|---|---|---|
| Analytical focus | One feature at a time | Many features simultaneously |
| Main question answered | Which individual molecules changed significantly? | How do samples and molecular patterns differ as a whole? |
| Common methods | t-test, ANOVA, Wilcoxon test, linear models, FDR correction | PCA, clustering, PLS-DA, OPLS-DA, random forest, support vector machines |
| Common outputs | p-value, adjusted p-value, q-value, fold change, differential feature table, volcano plot | Score plot, loading plot, heatmap, VIP score, classification metrics, model validation results |
| Strengths | Direct, interpretable, suitable for differential feature screening | Captures correlated patterns, global structure, group separation, and feature combinations |
| Limitations | May miss coordinated weak signals and correlation structure | Can be sensitive to preprocessing, overfitting, and model assumptions |
| Best-use scenarios | Differential metabolite, protein, lipid, gene, or PTM site identification | Exploratory data analysis, batch assessment, biomarker panels, pattern discovery, multi-omics integration |
A feature may show a strong univariate signal but contribute little to global separation if it is not part of a broader pattern. Conversely, a feature may have a high VIP score in a supervised model but fail to pass FDR correction or show a weak fold change. Neither result should be interpreted in isolation.
For biomarker discovery, the strongest candidates usually require multiple lines of support: statistical significance, meaningful fold change, contribution to multivariate separation, biological relevance, pathway or network context, and validation in an independent dataset or targeted assay.
4. HOW TO USE BOTH APPROACHES IN AN OMICS DATA ANALYSIS WORKFLOW
A practical omics workflow begins with data preprocessing and quality assessment, then moves through exploratory analysis, differential feature screening, supervised modeling when appropriate, and biological interpretation. Each method has a specific role.
4.1 Start With Multivariate Exploration
PCA and clustering are commonly used near the beginning of an omics analysis. Their purpose is to examine the overall structure of the dataset before focusing on individual molecules. PCA score plots can show whether samples cluster by treatment, disease status, tissue type, time point, batch, sex, genotype, or another source of variation. Outlier samples may also become visible at this stage.
This exploratory step is useful because hidden technical variation can mimic biological signals. Batch effects, sample handling differences, extraction variability, and instrument drift can influence high-dimensional datasets. Modern metabolomics platforms increasingly integrate statistical analysis, batch-effect correction, pathway analysis, and multi-omics interpretation in connected workflows (Pang et al., 2021).
PCA separation alone does not prove that individual molecules are significantly changed. It indicates that a major source of variation exists in the dataset. Follow-up univariate analysis is needed to identify which molecular features differ at the individual level and whether those differences remain significant after multiple testing correction.
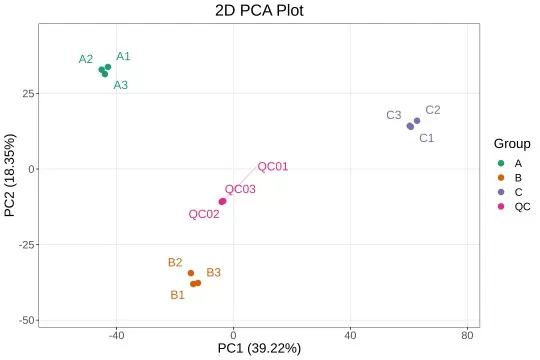
Figure 3. PCA Score Plot. Each point represents one sample; the plot shows how samples distribute along the first two principal components, revealing whether groups cluster separately and whether any samples appear as outliers.
4.2 Identify Differential Features With Univariate Statistics
After initial exploration, univariate analysis is used to generate differential feature lists. This step identifies metabolites, proteins, lipids, genes, or PTM sites that show statistically supported changes between defined groups. Fold change and adjusted p-value thresholds are often applied together to balance biological magnitude and statistical reliability.
Univariate results also serve as input for pathway analysis, enrichment analysis, functional annotation, and targeted validation. In transcriptomics, methods such as DESeq2 and limma illustrate how high-throughput differential analysis often combines fold-change estimation, variance modeling, and multiple testing correction to support feature-level interpretation (Love et al., 2014; Ritchie et al., 2015). Similar principles apply across proteomics, metabolomics, and lipidomics, even when platform-specific preprocessing differs.
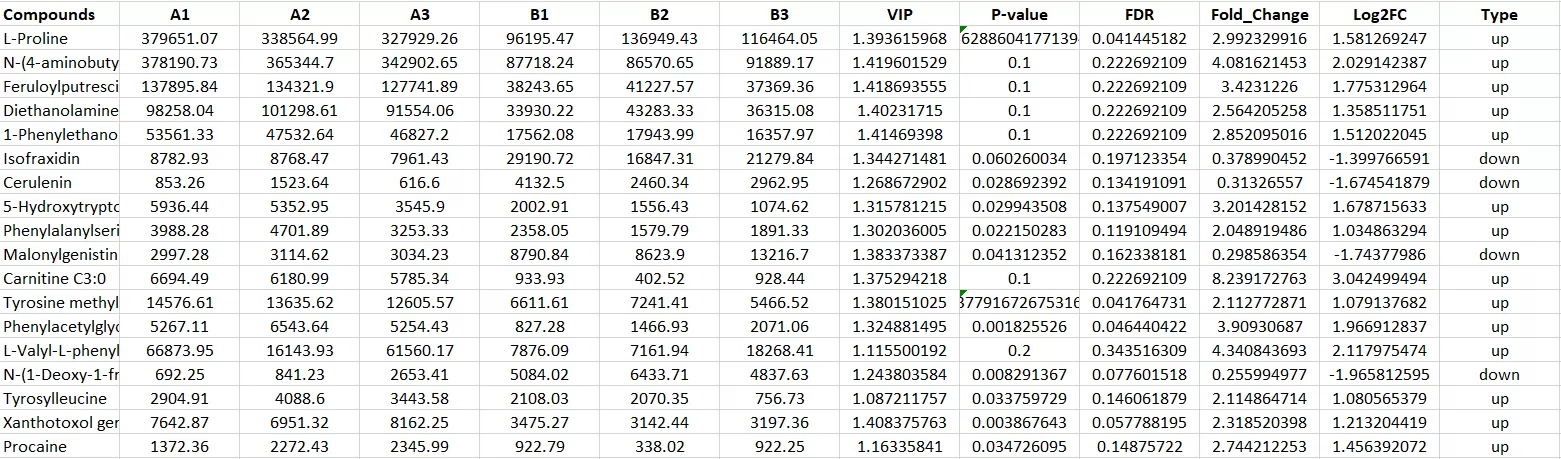
Figure 4. Differential Metabolite Table With Fold Change, p-Value, FDR, and VIP Scores. Combined statistical and multivariate metrics support more reliable differential feature prioritization.
4.3 Use Supervised Multivariate Models With Caution
Supervised multivariate models can be useful after exploratory and univariate analyses, especially when the goal is classification or biomarker panel development. PLS-DA and OPLS-DA can summarize group separation and identify variables that contribute to that separation. Random forest and support vector machines can also support predictive modeling when sample size, study design, and validation strategy are appropriate.
However, supervised methods can overfit high-dimensional omics datasets. A model may separate groups well in the training data but fail on new samples. Cross-validation, permutation testing, independent validation cohorts, and transparent reporting of model metrics are therefore important. A visually attractive PLS-DA score plot should not be interpreted as definitive biological evidence unless the model is properly validated.
VIP scores can help prioritize variables from PLS-based models, but they should be interpreted alongside p-values, q-values, fold change, raw abundance patterns, pathway relevance, and technical reliability.
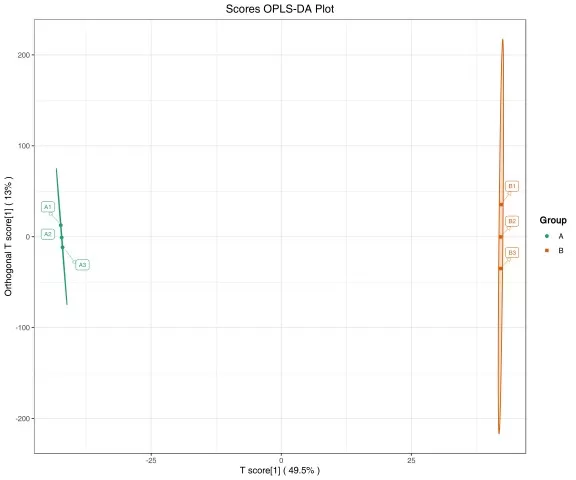
Figure 5. OPLS-DA Score Plot. The supervised model separates groups along the predictive component (t[1]); model validity should be confirmed through cross-validation and permutation testing before biological interpretation.
4.4 Integrate Statistical Evidence with Biological Interpretation
The final goal of omics data analysis is not only to list significant features. It is to connect molecular changes to biological mechanisms, phenotypes, or hypotheses. Therefore, statistical evidence should be integrated with pathway annotation, known biology, sample metadata, experimental design, and validation feasibility.
In multi-omics studies, integration methods can connect molecular layers such as transcripts, proteins, metabolites, lipids, and phenotypes. Tools such as mixOmics were developed to support multivariate feature selection and multiple data integration across omics datasets (Rohart et al., 2017). These approaches can reveal coordinated patterns that are not obvious from one omics layer alone.
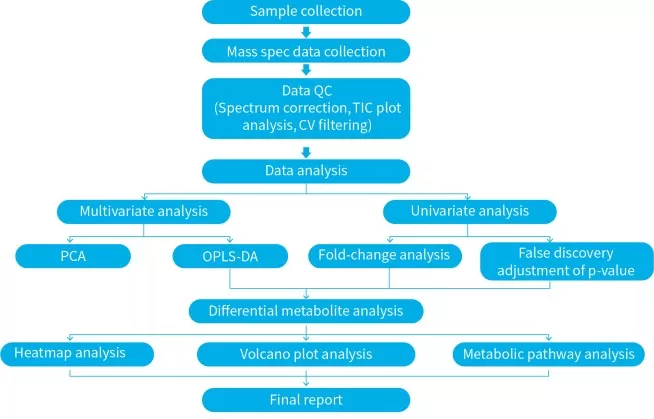
Figure 6. Diagram of A Typical Metabolomics Data Analysis Workflow. The workflow integrates data preprocessing, quality control, univariate differential analysis, multivariate modeling, and pathway enrichment into a connected analytical pipeline.
5. WHEN TO PRIORITIZE UNIVARIATE OR MULTIVARIATE ANALYSIS IN OMICS
Although univariate and multivariate analysis are complementary in a complete omics data analysis workflow, different research goals may require one approach to be emphasized at a specific stage. Univariate analysis is often prioritized for differential feature screening, while multivariate analysis is more important for exploring sample structure, group separation, classification, and multi-omics relationships. The table below summarizes how these priorities shift across common omics research objectives.
| Research goal | Recommended approach |
|---|---|
| Identify significantly changed metabolites, proteins, lipids, genes, or PTM sites | Univariate analysis with FDR correction and fold-change filtering |
| Detect outliers, batch effects, or unexpected sample structure | PCA and clustering |
| Evaluate global separation between biological groups | Multivariate analysis, especially PCA for exploration and supervised models when validated |
| Build a biomarker panel | Both approaches, followed by model validation and targeted confirmation |
| Interpret pathway-level changes | Differential feature analysis plus pathway enrichment and multivariate context |
| Explore relationships across multi-omics layers | Multivariate integration, correlation analysis, pathway-based integration, or network analysis |
6. FAQS
Is PCA univariate or multivariate?
PCA is a multivariate analysis method because it evaluates many variables at the same time. In omics data analysis, PCA reduces high-dimensional molecular data into a smaller number of principal components, helping researchers visualize sample distribution, outliers, batch effects, and major sources of variation.
Is a volcano plot univariate or multivariate?
A volcano plot is based on univariate differential analysis. Each point in a volcano plot represents one molecular feature, such as a metabolite, protein, lipid, transcript, or gene. The plot typically combines fold change with statistical significance, making it useful for screening differential features.
What is the difference between fold change and p-value in omics?
Fold change describes the magnitude and direction of a molecular difference between groups, while a p-value describes the statistical evidence for that difference. In omics studies, both metrics are important because a feature may show a large fold change but high variability, or a small but statistically consistent change.
What is the difference between p-value, adjusted p-value, and q-value?
A p-value is calculated for an individual statistical test, while an adjusted p-value accounts for multiple testing across many features. A q-value is commonly used to estimate false discovery rate control in high-throughput datasets. In omics research, adjusted p-values or q-values are usually more appropriate than raw p-values for selecting differential molecules.
What does VIP score mean in PLS-DA and OPLS-DA?
VIP score, or variable importance in projection, estimates how strongly a feature contributes to a PLS-DA or OPLS-DA model. A high VIP score can help prioritize variables associated with group separation, but it should not be used alone as biomarker evidence. Statistical significance, fold change, biological relevance, and model validation should also be considered.
Should biomarker discovery use univariate or multivariate analysis?
Biomarker discovery usually requires both univariate and multivariate analysis. Univariate analysis helps identify individual features with statistical evidence, while multivariate analysis evaluates whether combinations of features improve group separation or predictive classification. Strong biomarker candidates usually require validation in an independent cohort or targeted assay.
Why is FDR correction important in omics data analysis?
FDR correction is important because omics studies often test hundreds to thousands of molecular features at the same time. Without multiple testing correction, many false-positive results may appear statistically significant by chance. FDR-based adjustment helps make differential feature selection more reliable in high-throughput omics datasets.
How MetwareBio Supports Omics Data Analysis and Interpretation
Omics services should not stop at molecular detection. Reliable interpretation requires standardized preprocessing, statistically appropriate analysis, biologically meaningful visualization, and clear reporting. This is particularly important for projects involving metabolomics, proteomics, lipidomics, transcriptomics, or multi-omics integration.
MetwareBio provides omics data analysis support across multiple technology platforms, including differential feature screening, PCA and clustering, volcano plot visualization, pathway analysis, and multi-omics integration. Project-specific analysis strategies can be adapted to study design, sample type, comparison groups, and biological objectives. Data interpretation support also helps connect molecular changes to pathways, phenotypes, and follow-up validation strategies.
If you are interested in omics data analysis or multi-omics integration services, please do not hesitate to contact us.
Contact UsRead More: Omics Data Analysis Methods and Visualization
These articles extend the topics covered above, from multivariate modeling and dimensionality reduction to volcano plot interpretation and pathway enrichment — forming a complete analytical toolkit for omics researchers.
A practical guide for selecting among the three most widely used multivariate methods in metabolomics. Explains the conceptual differences between unsupervised PCA and supervised PLS-DA and OPLS-DA, and when each approach is appropriate for your study design.
Compares PCA and PLS-DA from a practical standpoint, covering model construction, interpretation of score plots and loading plots, and how to avoid overfitting in supervised multivariate omics models. Helps readers apply the right method to their dataset.
An in-depth look at principal component analysis for omics applications — how to read score and loading plots, identify batch effects and outliers, and interpret variance explained by each component as part of a broader quality assessment workflow.
Covers the mechanics and interpretation of volcano plots as a univariate visualization tool. Learn how fold change thresholds and significance cutoffs interact, how to handle multiple testing, and how volcano plots connect to downstream pathway analysis.
Statistical analysis results are only as reliable as the preprocessing steps that precede them. This article reviews normalization, scaling, missing value imputation, and transformation methods that directly affect both univariate and multivariate omics outputs.
Once differential features are identified through univariate analysis, pathway enrichment connects molecule-level results to biological functions. This guide compares GO, KEGG, and GSEA methods to help researchers select the most appropriate enrichment strategy.
References
- Benjamini, Y., & Hochberg, Y. (1995). Controlling the false discovery rate: A practical and powerful approach to multiple testing. Journal of the Royal Statistical Society: Series B (Methodological), 57(1), 289–300. https://doi.org/10.1111/j.2517-6161.1995.tb02031.x
- Gromski, P. S., Muhamadali, H., Ellis, D. I., Xu, Y., Correa, E., Turner, M. L., & Goodacre, R. (2015). A tutorial review: Metabolomics and partial least squares-discriminant analysis—a marriage of convenience or a shotgun wedding. Analytica Chimica Acta, 879, 10–23. https://doi.org/10.1016/j.aca.2015.02.012
- Jolliffe, I. T., & Cadima, J. (2016). Principal component analysis: A review and recent developments. Philosophical Transactions of the Royal Society A: Mathematical, Physical and Engineering Sciences, 374(2065), 20150202. https://doi.org/10.1098/rsta.2015.0202
- Love, M. I., Huber, W., & Anders, S. (2014). Moderated estimation of fold change and dispersion for RNA-seq data with DESeq2. Genome Biology, 15, 550. https://doi.org/10.1186/s13059-014-0550-8
- Pang, Z., Chong, J., Zhou, G., de Lima Morais, D. A., Chang, L., Barrette, M., Gauthier, C., Jacques, P.-É., Li, S., & Xia, J. (2021). MetaboAnalyst 5.0: Narrowing the gap between raw spectra and functional insights. Nucleic Acids Research, 49(W1), W388–W396. https://doi.org/10.1093/nar/gkab382
- Ritchie, M. E., Phipson, B., Wu, D., Hu, Y., Law, C. W., Shi, W., & Smyth, G. K. (2015). limma powers differential expression analyses for RNA-sequencing and microarray studies. Nucleic Acids Research, 43(7), e47. https://doi.org/10.1093/nar/gkv007
- Rohart, F., Gautier, B., Singh, A., & Lê Cao, K.-A. (2017). mixOmics: An R package for 'omics feature selection and multiple data integration. PLOS Computational Biology, 13(11), e1005752. https://doi.org/10.1371/journal.pcbi.1005752
- van den Berg, R. A., Hoefsloot, H. C. J., Westerhuis, J. A., Smilde, A. K., & van der Werf, M. J. (2006). Centering, scaling, and transformations: Improving the biological information content of metabolomics data. BMC Genomics, 7, 142. https://doi.org/10.1186/1471-2164-7-142
