The bicinchoninic acid (BCA) assay is widely used to measure total protein concentration in biological extracts and purified protein solutions. Its sensitivity and compatibility with many common detergents support routine laboratory analysis, while the microplate format allows multiple samples to be processed together. These measurements help researchers determine suitable sample volumes for applications such as Western blotting and mass spectrometry–based proteomics. This article covers the BCA assay principle, practical workflow, concentration calculations, and main advantages and limitations. It provides guidance for setting up the assay, interpreting measurements, and recognizing factors that affect result reliability.
1. Principle of the BCA Protein Assay
The BCA assay measures total protein through a copper-dependent color reaction. Under alkaline conditions, proteins promote the reduction of Cu²⁺ to Cu⁺. Two BCA molecules then bind one Cu⁺ ion to form a purple complex with strong absorbance at 562 nm. The signal is compared with standards of known protein concentration to estimate the concentration of an unknown sample (Smith et al., 1985). Protein structure, peptide bonds, and particular amino acid residues contribute to color formation, so different proteins can produce different responses (Wiechelman et al., 1988). Bovine serum albumin (BSA) is a practical calibration standard, and concentrations obtained for complex extracts are estimates relative to that reference.
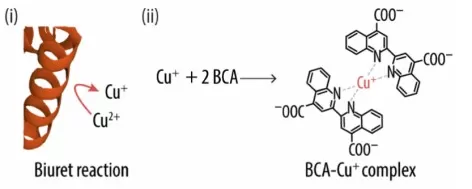
Reaction mechanism of the bicinchoninic acid (BCA) assay: (i) schematic of the biuret reaction showing the protein’s ability to reduce the cupric ion (Cu2+) to the cuprous one (Cu+) and (ii) formation of the BCA-Cu+ complex, which has the characteristic absorbance (Abs) signal at 562 nm. Image reproduced from Coll-Satue et al., 2024, Biomolecules, Figure 1A, licensed under CC BY 4.0.
2. Materials and Sample Preparation
The microplate BCA assay requires reagents A and B, a 2 mg/mL BSA stock, a compatible diluent, and standard liquid-handling supplies, including clean tubes, pipettes, and tips. Measurements are performed in a clear, flat-bottom 96-well plate with a cover, using a plate mixer, a 37 °C incubator, and an absorbance reader capable of measuring at 562 nm.
Extraction buffer composition can influence assay performance. Reducing agents such as DTT or TCEP can produce a signal independently of protein, while copper-chelating substances can interfere with the reaction. Compatibility varies with additive concentration, reagent formulation, and assay format, making the manufacturer’s guidance an important reference when assessing a buffer mixture (- Thermo Fisher Scientific, 2022). Standards and the protein-free blank are preferably prepared in a compatible buffer background that closely matches the diluted samples.
A separate sample aliquot is used for protein quantification, leaving the remaining material untreated for downstream experiments. Any dilution made before adding the working reagent is recorded so that the measured concentration can be corrected to the original sample concentration. For example, a 1:5 dilution contains one volume of sample and four volumes of diluent, corresponding to a dilution factor of 5.
3. Step-by-Step BCA Assay Protocol
The following procedure uses the Pierce BCA standard microplate format. The example calibration below covers 125–2,000 µg/mL; samples below that interval need appropriate lower standards or another validated assay configuration. Use the instructions for your specific kit when changing conditions (Thermo Fisher Scientific, 2026).
3.1 Preparation of Standards and Working Reagent
Prepare the following standards directly from the 2 mg/mL BSA stock. Each tube contains 400 µL before any assay reagent is added.
| BSA concentration | 2 mg/mL BSA stock | Compatible diluent | Total volume |
|---|---|---|---|
| 0 µg/mL — blank | 0 µL | 400 µL | 400 µL |
| 125 µg/mL | 25 µL | 375 µL | 400 µL |
| 250 µg/mL | 50 µL | 350 µL | 400 µL |
| 500 µg/mL | 100 µL | 300 µL | 400 µL |
| 750 µg/mL | 150 µL | 250 µL | 400 µL |
| 1,000 µg/mL | 200 µL | 200 µL | 400 µL |
| 1,500 µg/mL | 300 µL | 100 µL | 400 µL |
| 2,000 µg/mL | 400 µL | 0 µL | 400 µL |
Mix reagent A with reagent B at 50:1 by volume. For example, 5.0 mL of A plus 0.10 mL of B produces 5.10 mL of working reagent. Allow 200 µL per well plus dispensing excess (Thermo Fisher Scientific, 2026).
As a planning example, eight calibration solutions including the blank and four samples, each in duplicate, occupy 24 wells. They require 4.8 mL of working reagent, so the 5.10 mL preparation provides a small excess. Increase the preparation proportionally for additional samples or dilutions.
3.2 Color Development and Absorbance Measurement
When the sample concentration is unknown, include several preliminary dilutions. Run standards, blanks, and samples together:
- Load the plate. Add 25 µL of each solution per well, using duplicate or triplicate wells.
- Add working reagent. Add 200 µL per well and mix on a plate shaker for 30 seconds.
- Incubate. Cover the plate and hold it at 37 °C for 30 minutes.
- Cool and read. Equilibrate to room temperature, check for bubbles, and measure absorbance at 562 nm (Thermo Fisher Scientific, 2026).
Use consistent timing across the plate. BCA color continues to develop after incubation, so standards and samples must experience comparable temperature and timing conditions. Do not apply a standard curve from a differently incubated plate.
4. BCA Assay Results: Calculation and Interpretation
4.1 Standard Curve Construction
BCA assay data are first corrected by subtracting the mean blank absorbance from each standard and sample reading. This correction is applied only once, either by the reader software or during subsequent analysis. The standard curve relates BSA concentration before reagent addition on the horizontal axis to mean blank-corrected absorbance on the vertical axis. Because the BCA response may show curvature across the full concentration range, linear regression is appropriate only within an interval where the measured standards support a linear relationship (Thermo Fisher Scientific, 2026).
Reliable concentration estimates depend on interpolation within the calibrated range. Samples with absorbance above the highest standard require further dilution and repeat measurement, as extrapolation beyond the calibration range can produce inaccurate estimates. Readings below the lowest nonzero standard may be brought into range by reducing the sample’s pre-assay dilution or using a suitable calibration that extends to lower protein concentrations.
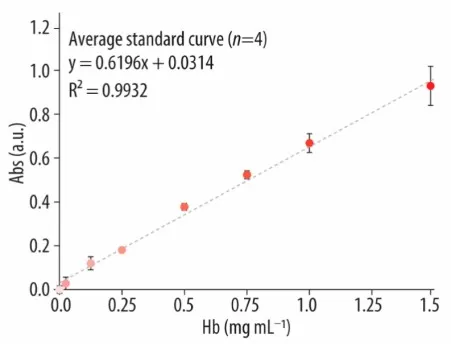
Example Calibration Curve for the BCA Protein Assay. Relationship between bovine hemoglobin concentration and absorbance at 562 nm under the study conditions. Image reproduced from Coll-Satue et al., 2024, Biomolecules, Figure 1C, licensed under CC BY 4.0.
4.2 Protein Concentration Calculations
For a validated linear interval, the calculation is:
A562 = mC + b
Coriginal = (A562 − b)/m × D
Here, A₅₆₂ is blank-corrected absorbance, m and b are the fitted slope and intercept, and D is the sample’s pre-assay dilution factor. For a nonlinear fit, obtain concentration from the fitted curve before multiplying by D. Correcting for pre-assay dilution recovers the original sample concentration (Merck, n.d.).
For an illustrative example, a valid linear fit is A₅₆₂ = 0.0010C + 0.010, where C is in µg/mL. A corrected sample absorbance of 0.610 gives:
Cdiluted = (0.610 − 0.010)/0.0010 = 600 µg/mL
If the sample was diluted 1:5 before the assay:
Coriginal = 600 × 5 = 3,000 µg/mL = 3.0 mg/mL
4.3 Result Reliability Assessment
Agreement between replicate readings and dilution-corrected concentrations provides an indication of measurement consistency. Substantial differences may reflect pipetting variability, inconsistent incubation, or interference from buffer components (Thermo Fisher Scientific, 2026). Blank correction accounts for background absorbance but cannot compensate for every form of chemical interference, particularly when a substance alters color development in the presence of protein (Wiechelman et al., 1988). Results with unexplained discrepancies require further assessment before they can reliably guide protein input for downstream experiments.
5. Advantages and Limitations of the BCA Assay
The BCA assay combines useful sensitivity with a convenient plate-based workflow and tolerates many detergents under specified conditions (Smith et al., 1985). It is therefore a practical option for compatible protein extracts, particularly when several samples need to be processed together. Its performance still depends on controlling the incubation and matching sample treatment to calibration.
The main limitations are interference from reducing or copper-binding substances and variation in protein response. Reducing-agent-compatible formulations have separate instructions; their compatibility cannot be assumed for the standard assay. Similarly, tolerance of one detergent does not establish compatibility with an entire lysis buffer. Our BCA versus Bradford comparison provides further context for selecting an assay.
Preparing Samples for Proteomics?
BCA protein quantification helps researchers determine suitable sample volumes for downstream proteomics. Building on this preparation step, MetwareBio’s proteomics services support protein analysis through sample processing, LC–MS/MS measurement, and bioinformatics. If you are planning a proteomics study, contact our team to discuss how your sample type, extraction conditions, and research goals can inform sample preparation and submission.
Contact UsRead More: Protein Quantification and Proteomics Sample Preparation
Accurate total protein quantification is a key step before digestion and sample loading in many proteomics workflows. The articles below compare alternative assays and explain the sample preparation steps that connect protein measurement with LC–MS/MS analysis.
A direct comparison of the two most common colorimetric protein assays, covering sensitivity, linear range, buffer compatibility, and throughput. Essential context when choosing between assays for your specific buffer system and sample concentration.
Learn the principle, compatible sample types, and common interferences of the Lowry assay, including a Lowry vs BCA vs Bradford comparison table for choosing the right method based on sample chemistry, workflow speed, and required sensitivity.
A full workflow guide from sample collection through quantification, reduction/alkylation, digestion, and labeling. Explains why a consistent, interference-aware protein assay underpins reliable normalization in large proteomics studies.
Step-by-step coverage of enzymatic digestion and C18 desalting after protein extraction, including trypsin/Lys-C strategies and in-solution digestion parameters. Connects accurate protein input to high-quality peptide mixtures for MS analysis.
An end-to-end introduction to bottom-up proteomics, from depletion and extraction through reduction, alkylation, digestion, and LC–MS/MS acquisition. Ideal context for why total protein quantification matters before digestion.
Explains the peptide-centric strategy behind most LC–MS/MS proteomics, including sample preparation quality control, digestion efficiency, and computational analysis. Shows how upstream quantification choices propagate into final protein identifications.