Spatial metabolomics maps metabolite distributions within tissues, preserving anatomical context and revealing metabolic heterogeneity that bulk metabolomics can obscure. However, translating mass spectrometry imaging (MSI) signals into reliable quantitative measurements remains challenging because tissue composition, ionization efficiency, and sampling conditions can affect signal intensity. Quantitative spatial metabolomics addresses these challenges through internal standards, calibration strategies, and validated workflows, supporting measurements that range from relative abundance comparisons to absolute metabolite amounts or concentrations. This article examines the analytical challenges of spatial metabolite quantification, reviews advances in quantitative strategies across imaging and localized sampling platforms, and discusses future priorities for measurement reliability and biological interpretation. It helps researchers select appropriate quantitative approaches, define realistic study objectives, and interpret regional metabolic differences with a clearer understanding of measurement uncertainty and analytical limitations.
1. Challenges in Quantitative Spatial Metabolomics
Spatial metabolomics measures molecules from defined locations on tissue sections, preserving the anatomical context of each measurement. However, each pixel or sampling spot reflects both metabolite abundance and the local conditions governing molecular sampling and ionization. Reliable spatial metabolite quantification requires control of these effects, with absolute measurements additionally requiring calibration against known analyte amounts or concentrations.
1) Spatially varying ionization and matrix effects. In MSI, metabolites are ionized together with other molecules originating from the same tissue location, often with limited separation before detection. Regional differences in salts, lipids, and other components can alter ion suppression and adduct formation. Consequently, image contrast may reflect changes in analytical response as well as metabolite abundance (Lanekoff et al., 2014).
2) Incomplete local sampling and uncertain tissue quantities. A pixel records molecules desorbed or extracted from a small tissue region, and the recovered fraction depends on the sampling method and conditions. In liquid-extraction imaging, extraction efficiency and effective sampling depth influence the amount entering the instrument. Converting that amount into tissue concentration requires a defined sampling volume or tissue mass; nominal pixel dimensions alone may be insufficient (Yin et al., 2019).
3) Different behavior of standards and endogenous metabolites. Standards sprayed onto a section remain initially at the tissue surface, while endogenous metabolites are distributed within cells and extracellular structures. They may therefore differ in extraction, accessibility, or incorporation into MALDI matrix crystals. Uniform standard deposition can improve signal correction without fully reproducing endogenous analyte recovery, making the choice of calibration material important (Watanabe et al., 2024).
4) Limited reference coverage and molecular specificity. Spatial measurements can detect chemically diverse metabolites within the same acquisition, but one internal standard cannot represent their different analytical responses. Moreover, unresolved isomers or isobars can contribute to a shared signal. Absolute quantification requires both an appropriate quantitative reference and sufficient molecular specificity to establish which compound is being measured (Vandenbosch et al., 2023; Golubova & Lanekoff, 2026).
5) Spatial preparation artifacts and acquisition variability. Tissue preparation must preserve molecular localization while producing a consistent analytical response. Uneven matrix or standard deposition can introduce position-dependent signal variation, while instrument drift during extended scans adds time-dependent variation. Together, these effects can create apparent regional differences and reduce comparability across sections or batches (Huang et al., 2025).
Reliable quantitative spatial metabolomics consequently depends on coordinated control of local sampling, molecular identification, reference standards, and calibration.
2. Advances in Quantitative Methods for Spatial Metabolomics
Recent advances in quantitative spatial metabolomics address complementary challenges in signal correction, calibration, and molecular specificity. Their outputs range from more reliable relative comparisons to calibrated detected concentrations and absolute quantity estimates, with interpretation depending on the analytes, tissue matrix, and validation performed. For platform principles and broader applications, see our overview of MALDI-MSI and AFADESI-MSI.
2.1 Quantitative MALDI-MSI: Internal Standards and Tissue-Based Calibration
Quantitative matrix-assisted laser desorption/ionization mass spectrometry imaging (MALDI-MSI) commonly uses isotope-labeled standards deposited across tissue sections. Endogenous analyte signals are normalized against corresponding standard signals, and calibration relates these ratios to known analyte amounts. Calibration materials can include standards spotted onto tissue or tissue-mimetic sections containing known concentrations. Watanabe et al. developed powdered brain tissue standards and combined them with isotope-labeled internal standards to quantify dopamine and its metabolites, providing a practical example of tissue-based calibration (Watanabe et al., 2024).
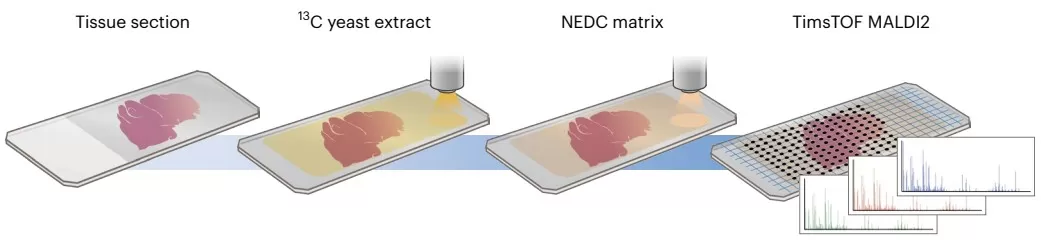
Wang et al. expanded internal standard coverage using a ¹³C-labeled yeast extract containing multiple labeled metabolites. Matching endogenous signals to labeled counterparts supported pixelwise normalization across a broader range of compounds. For selected metabolites, they generated calibration curves using unlabeled yeast extracts whose metabolite concentrations had first been determined by nuclear magnetic resonance (NMR), with calibrants spotted beside the tissue sections. The advance therefore combines broad signal correction with metabolite-specific calibration; the availability of a labeled reference alone does not establish an absolute concentration (Wang et al., 2025).
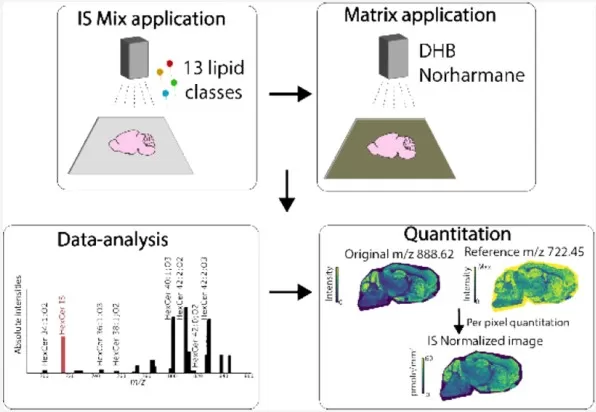
For spatial lipidomics, Vandenbosch et al. (2023) combined a multiclass internal standard mixture with MALDI-MSI and MALDI-2 imaging, which incorporates laser postionization. Lipid-to-standard signal ratios were scaled by known standard loadings to estimate lipid amounts per tissue area, reported in pmol/mm². This expands quantitative coverage across lipid classes while relying on assumptions about analytical response within each class. The estimates remain sensitive to response differences, overlapping signals, and the detectability of the selected standards.
2.2 Quantitative DESI-MSI and Nano-DESI-MSI: Surface Sampling and Calibration
Quantitative desorption electrospray ionization (DESI)-MSI can use tissue-mimetic calibration to connect regional signals with known analyte concentrations. A targeted DESI-MSI study demonstrated this approach for chloroquine in mouse kidney, providing a methodological example of quantitative tissue imaging (Rahman et al., 2025).
Nano-DESI (nanospray desorption electrospray ionization) uses a liquid bridge to extract metabolites locally from the tissue surface and transfer them to an electrospray emitter. Internal standards supplied through the solvent share the analyte stream and can help correct ionization-related variation. With appropriate calibration, the resulting signals can estimate concentrations in the sampled liquid. Conversion to quantities in the original tissue additionally requires evaluation of extraction recovery and sampling geometry, or calibration shown to account for these effects (Yin et al., 2019; Davidová & Lanekoff, 2025).
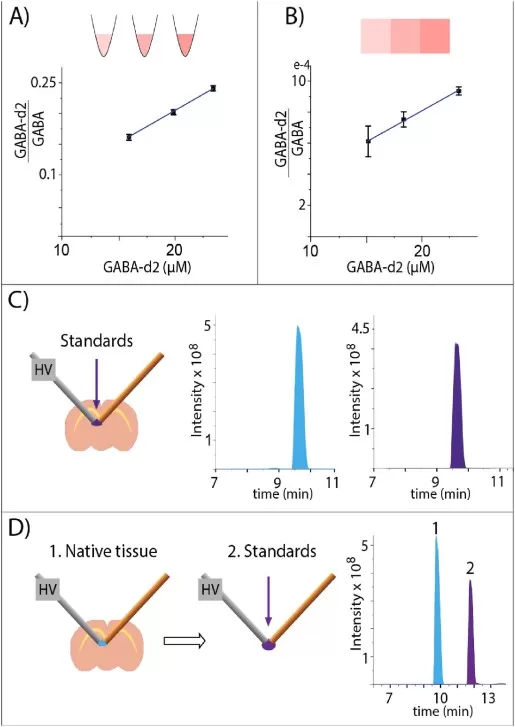
Davidová and Lanekoff advanced calibration using standard addition with pneumatically assisted nano-DESI. Standards were supplied at different concentrations during alternating imaging line scans, allowing quantitative relationships to be established from the response to added analytes in the presence of the tissue-derived matrix. This strategy reduces dependence on isotope-labeled standards, although its spatial interpretation must account for the different tissue positions sampled at each addition level (Davidová & Lanekoff, 2025).
2.3 Quantitative SS-CE-MS: Localized Sampling with Isomer Separation
Surface sampling capillary electrophoresis–mass spectrometry (SS-CE-MS) couples localized tissue extraction with electrophoretic separation before MS detection. Separation adds molecular specificity to spatial quantification, allowing selected compounds with identical masses to be measured independently.
Golubova and Lanekoff evaluated five quantification strategies and identified sequential tissue sampling followed by standard injection within the same CE run as the preferred approach under their experimental conditions. Applied to rat brain sections, the method established quantitative regional profiles of metabolites and neurotransmitters, including distinct distributions of leucine and isoleucine (Golubova & Lanekoff, 2026).
This study addresses two important barriers: standard-referenced measurement after spatial sampling and discrimination of metabolites contributing to the same mass signal. Its reported detected concentrations characterize recovered analytes; the authors explicitly identify unknown extraction yield as a limitation in determining original tissue amounts. Tissue-level absolute quantification would require recovery and sampling information, or calibration demonstrated to account for those effects.
3. Future Perspectives of Quantitative Spatial Metabolomics
Future progress in quantitative spatial metabolomics will depend on making measurements comparable, maintaining quantitative performance at finer spatial scales, and connecting metabolic quantities with cellular context.
3.1 Cross-Laboratory Comparability and Reporting
Quantitative spatial metabolomics needs reporting practices that allow measurements from different studies to be interpreted on a common basis. SMART provides a framework for describing core MSI acquisition and performance parameters (Xi et al., 2023). Building on such initiatives, future quantitative reporting could document the measured quantity, reporting units, calibration basis, and uncertainty alongside imaging metadata. Shared reference samples and interlaboratory comparisons could then test whether numerical results remain comparable across workflows. Agreement between laboratories also needs evaluation against independently assigned reference values, helping distinguish measurement reproducibility from quantitative accuracy.
3.2 Reliable Quantification at Cellular Resolution
Finer spatial resolution is most informative when accompanied by sufficient sensitivity and precision for the metabolites being measured. Smaller sampling areas generally yield less material, making low-abundance signals harder to quantify consistently. Microscopy-integrated MSI has enabled assignment of lipid profiles to individual cells, illustrating the importance of spatial registration alongside pixel size (Potthoff et al., 2025). Future benchmarking could therefore evaluate detection limits, quantitative variability, and molecular coverage at the intended cellular or regional scale. These assessments would help researchers select a resolution that supports their quantitative question while accounting for acquisition time and biological replication.
3.3 Integrating Quantitative Maps with Cellular Context
Integrating quantitative metabolite maps with histology and spatial transcriptomics could help separate changes in cell composition from metabolic changes within a cell population. SpatialMETA demonstrates computational integration of spatial transcriptomic and metabolomic datasets (Tian et al., 2025). For quantitative interpretation, future workflows need to retain measured units and uncertainty while accounting for differences in sampling area, tissue alignment, and resolution between modalities. Integrated expression patterns can guide hypotheses about metabolic regulation, but they do not independently establish metabolite concentrations, pathway fluxes, or causal mechanisms. These conclusions require appropriate quantitative measurements and experimental validation.
Frequently Asked Questions About Quantitative Spatial Metabolomics
Q1. What is quantitative spatial metabolomics?
Quantitative spatial metabolomics measures metabolite abundance at defined locations within tissues while preserving anatomical context. Depending on the analytical workflow, results may represent normalized relative abundances or calibrated absolute amounts or concentrations. It enables researchers to investigate regional metabolic differences, with the interpretation determined by the calibration and validation performed.
Q2. How is absolute quantification achieved in spatial metabolomics?
Absolute quantification uses reference standards of known amounts or concentrations and validated calibration models to convert mass spectrometry signals into metabolite quantities. Reliable tissue-level measurements must account for local matrix effects, analyte recovery, and the sampled tissue area, mass, or volume. Internal standard normalization improves quantitative reliability but does not, by itself, establish absolute tissue concentrations.
Q3. What is the difference between spatial metabolomics and spatial metabolic flux analysis?
Spatial metabolomics measures where metabolites occur and how abundant they are. Spatial metabolic flux analysis investigates metabolic processes, such as synthesis and turnover, within tissue regions. It combines spatial measurements with stable isotope tracing and suitable experimental designs and metabolic models. Metabolite abundance or isotope enrichment alone does not establish absolute metabolic reaction rates (Schwaiger-Haber et al., 2023). Learn more about spatial metabolic flux mapping.
Q4. Which technologies are used for quantitative spatial metabolomics?
Platforms include MALDI mass spectrometry imaging (MALDI-MSI), DESI-MSI, and nano-DESI-MSI. Surface sampling capillary electrophoresis–mass spectrometry (SS-CE-MS) provides complementary spatial measurements with separation of certain metabolite isomers. Quantitative performance depends on the analyte, sampling method, standards, and calibration strategy; selecting a particular platform does not automatically ensure absolute quantification.
Q5. What samples can be analyzed using spatial metabolomics?
Spatial metabolomics can analyze human and animal tissue sections, including brain, tumor, liver, and kidney, as well as plant tissues. Fresh-frozen samples are generally preferred for preserving native metabolite distributions. Sample suitability depends on the target metabolites, preservation and embedding procedures, and analytical platform. Formalin-fixed, paraffin-embedded tissues require method-specific assessment because processing can alter metabolite abundance and localization.
Explore MetwareBio’s Spatial Metabolomics Services
MetwareBio provides established spatial metabolomics solutions for biomedical and plant research based on mass spectrometry imaging technologies, supporting tissue metabolic mapping, metabolic heterogeneity analysis, and biological mechanism studies.
- Untargeted Spatial Metabolomics: MALDI-MSI and AFADESI-MSI workflows for broad metabolite mapping and analysis of regional metabolic heterogeneity.
- Spatial Lipidomics: MALDI-MSI-based lipid imaging to investigate tissue-specific lipid distributions and regional lipid remodeling.
- Neurotransmitter Spatial Profiling: Specialized MALDI-MSI workflows with tailored derivatization to visualize neurotransmitters and related metabolites within nervous system tissues.
- Phytohormone Spatial Profiling: MALDI-MSI workflows with tailored derivatization to map plant hormones and related metabolites, supporting research into tissue-specific development and stress responses.
Our technical team can help assess sample compatibility, molecular coverage, spatial resolution, and project-specific quantification requirements. Feel free to contact us to discuss your research goals and explore a suitable spatial metabolomics strategy.
Contact UsRead More: Spatial Metabolomics and Quantitative Imaging
These articles extend the quantitative and spatial themes covered here, from MSI platform workflows and imaging data analysis to stable isotope tracing and the service options behind them.
MetwareBio's MALDI-MSI and AFADESI-MSI workflows map 1,400+ compounds directly in tissue sections at 5–100 µm resolution. A useful reference point for the platform-level capabilities discussed in the challenges section.
Explains how isotope tracers combine with MSI to resolve nutrient fate across tissue regions, and where enrichment stops short of true flux. Directly extends the abundance-versus-flux distinction raised in the FAQ.
A step-by-step account of sample preparation, matrix application, raster acquisition, and spatial mapping, with applications in cancer, neuroscience, and drug development. Good grounding for the signal-correction issues described here.
Covers normalization, segmentation and clustering, co-localization, ROI comparisons, and pathway enrichment for imaging datasets. Helps connect quantitative pixel values to the regional interpretations discussed in this article.
An overview of MSI principles, resolution trade-offs, and multivariate analysis for spatial datasets. Useful context for choosing the spatial scale at which quantitative comparisons remain meaningful.
Explore MALDI-MSI and AFADESI-MSI workflows with spatial resolution options spanning 5–100 µm and reported average detection of 1,400+ compounds. Actual resolution and coverage depend on the platform, tissue, and project design.
References
- Davidová, L., & Lanekoff, I. (2025). Standard addition as a method for quantitative mass spectrometry imaging. Analytical Chemistry, 97(22), 11572–11580. https://doi.org/10.1021/acs.analchem.5c00549
- Golubova, A., & Lanekoff, I. (2026). Quantitative approaches for spatial metabolomics with isomer differentiation using surface sampling capillary electrophoresis mass spectrometry. Talanta, 296, 128482. https://doi.org/10.1016/j.talanta.2025.128482
- Huang, L., Kim, Y., Balluff, B., & Cillero-Pastor, B. (2025). Quality control standards for batch effect evaluation and correction in mass spectrometry imaging. Analytical Chemistry, 97(20), 10919–10928. https://doi.org/10.1021/acs.analchem.5c02020
- Lanekoff, I., Stevens, S. L., Stenzel-Poore, M. P., & Laskin, J. (2014). Matrix effects in biological mass spectrometry imaging: Identification and compensation. Analyst, 139(14), 3528–3532. https://doi.org/10.1039/C4AN00504J
- Potthoff, A., Schwenzfeier, J., Niehaus, M., Bessler, S., Hoffmann, E., Soehnlein, O., Höhndorf, J., Dreisewerd, K., & Soltwisch, J. (2025). Spatial biology using single-cell mass spectrometry imaging and integrated microscopy. Nature Communications, 16, 9129. https://doi.org/10.1038/s41467-025-64603-8
- Rahman, M. M., Afroz, M. S., Mamun, M. A., Islam, A., Sakamoto, T., Aramaki, S., Sato, T., Paxton, T., Takahashi, Y., Kahyo, T., & Setou, M. (2025). Quantitative mass spectrometry imaging by targeted-DESI-MSI in MRM mode provides higher sensitivity and specificity for fast quantification of chloroquine drug in mice kidney. Journal of Mass Spectrometry, 60(7), e5148. https://doi.org/10.1002/jms.5148
- Schwaiger-Haber, M., Stancliffe, E., Anbukumar, D. S., Sells, B., Yi, J., Cho, K., Adkins-Travis, K., Chheda, M. G., Shriver, L. P., & Patti, G. J. (2023). Using mass spectrometry imaging to map fluxes quantitatively in the tumor ecosystem. Nature Communications, 14, 2876. https://doi.org/10.1038/s41467-023-38403-x
- Tian, R., Xue, Z., Chen, Y., Qi, Y., Zhang, J., Yuan, J., Ruan, D., Lin, J., Liu, J., Wang, D., Ye, Y., & Liu, W. (2025). Integrating cross-sample and cross-modal data for spatial transcriptomics and metabolomics with SpatialMETA. Nature Communications, 16, 8855. https://doi.org/10.1038/s41467-025-63915-z
- Vandenbosch, M., Mutuku, S. M., Mantas, M. J. Q., Patterson, N. H., Hallmark, T., Claesen, M., Heeren, R. M. A., Hatcher, N. G., Verbeeck, N., Ekroos, K., & Ellis, S. R. (2023). Toward omics-scale quantitative mass spectrometry imaging of lipids in brain tissue using a multiclass internal standard mixture. Analytical Chemistry, 95(51), 18719–18730. https://doi.org/10.1021/acs.analchem.3c02724
- Wang, G., van den Berg, B. M., Kostidis, S., Pinkham, K., Jacobs, M. E., Liesz, A., Giera, M., & Rabelink, T. J. (2025). Spatial quantitative metabolomics enables identification of remote and sustained ipsilateral cortical metabolic reprogramming after stroke. Nature Metabolism, 7, 1791–1800. https://doi.org/10.1038/s42255-025-01340-8
- Watanabe, K., Takayama, S., Yamada, T., Hashimoto, M., Tadano, J., Nakagawa, T., Watanabe, T., Fukusaki, E., Miyawaki, I., & Shimma, S. (2024). Novel mimetic tissue standards for precise quantitative mass spectrometry imaging of drug and neurotransmitter concentrations in rat brain tissues. Analytical and Bioanalytical Chemistry, 416(26), 5579–5593. https://doi.org/10.1007/s00216-024-05477-5
- Xi, Y., Sohn, A. L., Joignant, A. N., Cologna, S. M., Prentice, B. M., & Muddiman, D. C. (2023). SMART: A data reporting standard for mass spectrometry imaging. Journal of Mass Spectrometry, 58(2), e4904. https://doi.org/10.1002/jms.4904
- Yin, R., Burnum-Johnson, K. E., Sun, X., Dey, S. K., & Laskin, J. (2019). High spatial resolution imaging of biological tissues using nanospray desorption electrospray ionization mass spectrometry. Nature Protocols, 14(12), 3445–3470. https://doi.org/10.1038/s41596-019-0237-4