Accurate total protein quantification supports consistent sample preparation for electrophoresis, Western blotting, and mass spectrometry–based proteomics. The Bradford protein assay is widely used for routine protein concentration measurement. Its rapid workflow, simple reagent requirements, and compatibility with standard absorbance readers make it a practical choice for laboratories processing individual samples or larger batches. This article explains the Bradford assay principle, experimental procedure, concentration calculations, and key advantages and limitations. It helps researchers perform the assay correctly, interpret results, and assess measurement reliability before proceeding with downstream experiments.
1. Principle of the Bradford Protein Assay
The Bradford assay measures protein concentration using Coomassie Brilliant Blue G-250. In an acidic reagent, protein binding stabilizes the blue form of the dye, increasing absorbance at 595 nm. Within an appropriate calibration range, this response allows an unknown sample to be compared with protein standards of known concentration (Bradford, 1976). Dye binding depends on protein composition, particularly arginine residues, with contributions from other interactions. Different proteins can therefore produce different signals at the same mass concentration (Compton & Jones, 1985). Bovine serum albumin (BSA) is commonly used as a practical reference; measurements of complex samples are consequently estimates relative to that standard. The assay provides an estimate of total protein concentration and does not resolve individual proteins or their abundance changes.
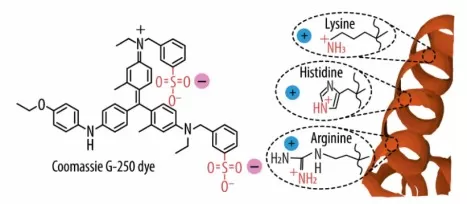
Reaction mechanism of the Coomassie blue (CB) assay: electrostatic interactions between the Coomassie G-250 dye and the basic amino acids of a protein. Image reproduced from Coll-Satue et al., 2024, Biomolecules, Figure 2A, licensed under CC BY 4.0.
2. Materials and Sample Preparation
Prepare the following materials before starting:
- Ready-to-use Bradford dye reagent.
- BSA standard solution at 1 mg/mL, equivalent to 1,000 µg/mL.
- A compatible dilution buffer.
- Protein samples, clean tubes, pipettes, and tips.
- A clear, flat-bottom 96-well plate, plate mixer, and absorbance reader.
Buffer composition matters because some additives affect dye behavior. Prepare standards in the same compatible buffer background as the diluted samples whenever practical. The blank contains this buffer without protein and receives dye reagent during the assay. Standards, blanks, and samples must undergo the same treatment for their readings to be comparable (QIAGEN, n.d.).
Use dissolved protein samples without visible suspended material. Check the reagent manufacturer’s compatibility guidance before measuring detergent-containing lysates. Reserve a separate, untreated portion for downstream experiments: only a small aliquot is needed for the concentration assay.
3. Step-by-Step Bradford Assay Protocol
The procedure below follows the Bio-Rad Quick Start Bradford standard microplate format, using ready-to-use 1× reagent. Its stated linear range with BSA is 125–1,000 µg/mL. Other Bradford formulations may require different conditions (Bio-Rad, n.d.).
3.1 Prepare the BSA Standards
The following preparation scheme produces 200 µL of each standard from a 1 mg/mL BSA stock.
| BSA concentration before adding dye | 1 mg/mL BSA stock | Compatible buffer | Total volume |
|---|---|---|---|
| 0 µg/mL — blank | 0 µL | 200 µL | 200 µL |
| 125 µg/mL | 25 µL | 175 µL | 200 µL |
| 250 µg/mL | 50 µL | 150 µL | 200 µL |
| 500 µg/mL | 100 µL | 100 µL | 200 µL |
| 750 µg/mL | 150 µL | 50 µL | 200 µL |
| 1,000 µg/mL | 200 µL | 0 µL | 200 µL |
Mix each standard thoroughly before transferring it to the plate. These volumes follow the dilution relationship C₁V₁ = C₂V₂. For example, 25 µL of a 1,000 µg/mL stock brought to 200 µL gives 125 µg/mL.
3.2 Performing the Bradford Assay
If the sample concentration is unknown, test several preliminary dilutions so that at least one falls within the calibration range. Record each dilution clearly. A 1:5 dilution means one volume of sample plus four volumes of buffer.
Perform the assay as follows:
- Equilibrate the reagent. Bring the 1× dye reagent to room temperature and gently invert it before use.
- Load the plate. Add 5 µL of each standard, blank, or diluted sample to separate wells. Use duplicate or triplicate wells.
- Add dye reagent. Dispense 250 µL of 1× reagent into every well and mix using a plate mixer.
- Allow color development. Incubate at room temperature for at least 5 minutes and read within 1 hour. Use a consistent incubation time across the plate.
- Read absorbance. Measure all wells at 595 nm (Bio-Rad, n.d.).
Check for bubbles before reading, and maintain a consistent dispensing sequence so that standards and samples experience similar reaction times.
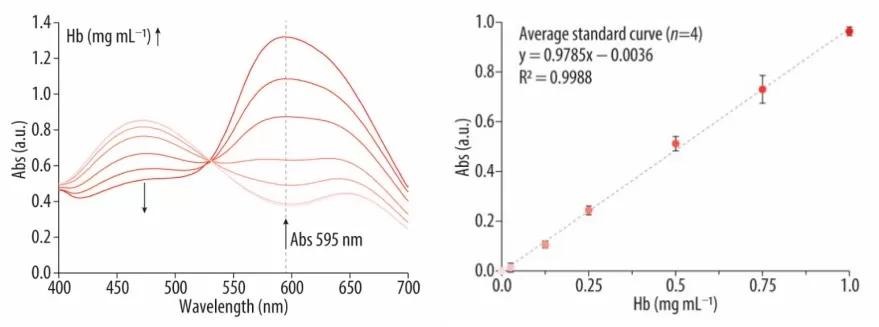
Absorbance spectra (left) and calibration curve (right) obtained using hemoglobin standards. Image reproduced from Coll-Satue et al., 2024, Biomolecules, Figure 2B–C, licensed under CC BY 4.0.
4. Calculating and Interpreting Bradford Assay Results
4.1 Build the Standard Curve
- Average the blank readings and subtract that value from each standard and sample reading. If the reader software already applies blank subtraction, do not subtract it again.
- Plot BSA concentration before dye addition on the horizontal axis and mean blank-corrected absorbance on the vertical axis. Determine each sample’s concentration from this calibration curve (Thermo Fisher Scientific, n.d.).
- Bradford responses can curve across a broad concentration range, so use linear regression only over a range supported by the measured standards. Inspect the plotted points and deviations from the fitted curve; a high R² alone does not establish that every part of the range is suitable. Samples outside the calibration range require another dilution or an appropriate alternative assay (Ernst & Zor, 2010).
4.2 Calculate Protein Concentration
For a valid linear calibration:
A595 = mC + b
Therefore:
Coriginal = (A595 − b)/m × D
Here, A₅₉₅ is the blank-corrected sample absorbance, m is the slope, b is the intercept, and D is the sample’s dilution factor before the assay.
For an illustrative calculation, suppose:
A595 = 0.0008C + 0.005
A diluted sample with a blank-corrected absorbance of 0.405 has:
Cdiluted = (0.405 − 0.005)/0.0008 = 500 µg/mL
If it was diluted 1:5:
Coriginal = 500 × 5 = 2,500 µg/mL = 2.5 mg/mL
Multiply only by the sample’s pre-assay dilution factor. Because the calibration concentrations refer to standards before dye addition, and standards and samples receive identical reagent volumes, the assay mixture’s dilution is already represented in the calibration.
4.3 Assess Result Reliability
Compare replicate wells and, when available, concentrations calculated from different sample dilutions. For example, a 1:5 dilution giving 500 µg/mL and a 1:10 dilution giving 250 µg/mL both indicate an original concentration of 2.5 mg/mL. Large disagreements warrant investigation before using the result. Check dilution records, pipetting, mixing, bubbles, and reaction timing. Persistent dilution-dependent differences may indicate buffer interference or an unsuitable calibration range. Matching the blank can correct background absorbance, but it cannot necessarily correct an additive that changes the protein–dye response.
5. Advantages and Limitations of the Bradford Assay
The Bradford assay offers rapid color development and a simple workflow requiring basic absorbance equipment. These features make it useful for routine protein concentration checks when the sample and buffer are compatible (Bradford, 1976).
Its main limitations arise from protein-dependent dye binding and chemical interference. Detergents and some buffer components can alter the balance between dye forms, affecting the measured signal (Compton & Jones, 1985). Compatibility therefore needs to be assessed for the particular formulation and assay conditions. Standard protein choice also matters: BSA and another protein may produce different calibration responses, so maintaining a consistent standard helps comparisons across experiments (Bio-Rad, n.d.).
When buffer composition makes Bradford unsuitable, our BCA versus Bradford comparison provides further context for choosing a protein assay.
Preparing Samples for Proteomics?
Reliable total protein quantification helps establish consistent sample inputs for proteomics, alongside appropriate sample quality and buffer compatibility. MetwareBio’s proteomics services cover sample preparation, LC–MS/MS analysis, and bioinformatics. Share your sample type, extraction buffer, and research objective with our team to discuss preparation and submission requirements.
Contact UsRead More: Protein Quantification and Proteomics Sample Preparation
Accurate protein quantification helps standardize protein input before digestion. The articles below compare protein assays and explain the sample preparation steps leading to LC–MS/MS analysis.
A direct comparison of the two most common colorimetric protein assays, covering sensitivity, linear range, buffer compatibility, and throughput. The natural next read when Bradford interference becomes a problem in your buffer system.
Learn the principle, compatible sample types, and common interferences of the Lowry assay, including a Lowry vs BCA vs Bradford comparison table for choosing the right method based on sample chemistry and required sensitivity.
A full workflow guide from sample collection through quantification, reduction/alkylation, digestion, and labeling. Explains why a consistent, interference-aware protein assay underpins reliable normalization in large proteomics studies.
Step-by-step coverage of enzymatic digestion and C18 desalting after protein extraction, including trypsin/Lys-C strategies and in-solution digestion parameters. Connects accurate protein input to high-quality peptide mixtures for MS analysis.
An end-to-end introduction to bottom-up proteomics, from depletion and extraction through reduction, alkylation, digestion, and LC–MS/MS acquisition. Ideal context for why total protein quantification matters before digestion.
Explains the peptide-centric strategy behind most LC–MS/MS proteomics, including sample preparation quality control, digestion efficiency, and computational analysis. Shows how upstream quantification choices propagate into final protein identifications.
References
- Bradford, M. M. (1976). A rapid and sensitive method for the quantitation of microgram quantities of protein utilizing the principle of protein-dye binding. Analytical Biochemistry, 72, 248–254. https://doi.org/10.1016/0003-2697(76)90527-3
- Coll-Satue, C., Jansman, M. M. T., & Hosta-Rigau, L. (2024). Comparative evaluation of UV-Vis spectroscopy-based approaches for hemoglobin quantification: Method selection and practical insights. Biomolecules, 14(9), 1046. https://doi.org/10.3390/biom14091046
-
Compton, S. J., & Jones, C. G. (1985). Mechanism of dye response and interference in the Bradford protein assay. Analytical Biochemistry, 151(2), 369–374.
https://doi.org/10.1016/0003-2697(85)90190-3 - Ernst, O., & Zor, T. (2010). Linearization of the Bradford protein assay. Journal of Visualized Experiments, 38, 1918. https://doi.org/10.3791/1918
- Bio-Rad. (n.d.). Quick Start Bradford Protein Assay Instruction Manual. Document 4110065A. https://www.bio-rad.com/webroot/web/pdf/lsr/literature/4110065A.pdf
- QIAGEN. (n.d.). Quantifying proteins using the Bradford method. https://www.qiagen.com/us/knowledge-and-support/knowledge-hub/bench-guide/protein/protein-analysis/quantifying-proteins-using-the-bradford-method
- Thermo Fisher Scientific. (2026). Pierce Bradford Plus Protein Assay Kit User Guide. (Publication MAN0011203, Revision D, June 18, 2026). https://documents.thermofisher.com/TFS-Assets/LSG/manuals/MAN0011203_CoomassiePlus_Bradford_Asy_UG.pdf