
In contemporary multi-omics research, one of the major challenges is transforming long lists of differentially expressed genes, proteins, or transcripts into coherent biological insights. Functional annotation and enrichment analysis provide a framework for interpreting molecular datasets by assigning genes or proteins to defined biological categories. Among the most widely used resources for this purpose are COG (Clusters of Orthologous Groups) and KOG (Eukaryotic Orthologous Groups) databases, which classify genes and proteins based on evolutionary relationships and functional similarities. Leveraging COG/KOG functional categories enables researchers to identify conserved biological processes, detect lineage-specific expansions, and integrate data across proteomics, transcriptomics, and metagenomics studies. This blog provides a detailed overview of COG and KOG, covering their functional classification principles, annotation workflows and applications in multi-omics analyses, aiming to guide researchers in extracting meaningful biological interpretations from complex datasets.
1. WHY ORTHOLOGOUS GROUPS MATTER IN FUNCTIONAL GENOMICS
Comprehensive genome and proteome annotation is fundamental to understanding cellular function and organismal biology. Beyond identifying gene sequences, accurately assigning functional roles and evolutionary relationships across species remains a key challenge, particularly for sequences with limited experimental characterization. While sequence similarity searches, such as BLAST, can identify homologs, distinguishing between orthologs and paralogs is essential for reliable functional inference. Orthologs—genes in different species that diverged through speciation—generally retain similar functions, making them suitable for transferring functional knowledge across organisms. In contrast, paralogs—arising from gene duplication events—may evolve new functions, and misclassification can lead to inaccurate annotations.
Orthologous groups offer a systematic solution by clustering proteins with shared evolutionary origins, enabling high-confidence propagation of functional annotations from well-studied model organisms to newly sequenced species. The COG (Clusters of Orthologous Groups) database focuses on prokaryotic genomes, whereas KOG (Eukaryotic Orthologous Groups) extends the framework to eukaryotes, organizing genes and proteins into functional categories that include energy production, metabolism, transcription, and signal transduction. Leveraging COG and KOG facilitates comparative genomic analyses, highlighting conserved pathways, gene expansions or losses, and lineage-specific adaptations. In multi-omics research, integrating COG/KOG annotation with transcriptomic and proteomic datasets allows systematic exploration of enriched functional categories, revealing key biological processes under varying experimental conditions. As a result, COG and KOG functional annotations have become integral components of bioinformatics pipelines, supporting studies in microbial ecology, evolutionary biology, and systems biology (Galperin et al., 2021; Huerta-Cepas et al., 2022).
2. COG vs KOG DATABASES: DEFINITIONS, SCOPE, AND KEY DIFFERENCES
COG and KOG are often mentioned together in functional annotation workflows, yet they were developed for different biological contexts and are best understood on their own terms. Both databases classify genes and proteins through orthologous relationships, but their organism coverage, update status, and analytical value are not the same.
2.1 What Is COG? A Prokaryotic Functional Classification System
The COG database was developed at NCBI as a systematic classification of orthologous proteins from completely sequenced prokaryotic genomes. Its construction is based on the bidirectional best hit method, which identifies orthologs by requiring that each protein in a pair is the other's best match in the respective genome (Tatusov et al., 1997). COGs are organized into functional categories denoted by letters A through Z, covering broad biological processes such as translation (J), transcription (K), energy production (C), and carbohydrate metabolism (G). These functional categories help researchers interpret large‑scale gene lists from transcriptomics or proteomics experiments in terms of biological processes and pathways. The most recent updates to the COG database expand prokaryotic coverage to include thousands of bacterial and archaeal genomes, improving its utility for contemporary comparative genomics and annotation workflows.
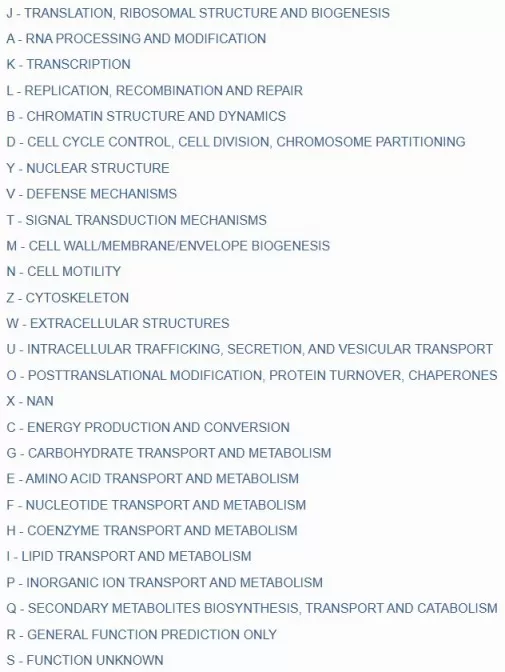
Figure 1. The COG categories in NCBI.
2.2 What is KOG? A Eukaryotic Functional Classification System
The KOG database extends the COG framework to eukaryotic genomes, grouping predicted proteins from representative eukaryotic species into orthologous sets. Each KOG cluster represents proteins presumed to be orthologous (or paralogous within species) across eukaryotic lineages, facilitating functional annotation in the context of complex genomes. The initial KOG set was derived from seven eukaryotic genomes: three animals (Caenorhabditis elegans, Drosophila melanogaster, Homo sapiens), one plant (Arabidopsis thaliana), two fungi (Saccharomyces cerevisiae and Schizosaccharomyces pombe), and one microsporidian (Encephalitozoon cuniculi) (Tatusov et al., 2003). Unlike COG, KOG accounts for the increased functional complexity and frequent domain shuffling characteristic of eukaryotic proteins. While maintaining a similar letter-based functional classification system, KOG categories reflect eukaryotic-specific processes such as signal transduction, cell cycle regulation, and multicellular organismal functions.
2.3 COG vs KOG: Database Differences and Use Scenarios
Although both COG and KOG databases share methodological foundations, they differ in organismal scope and database updates: the COG resource is actively maintained at NCBI with regular updates to reflect new prokaryotic genome sequences and expanded functional categories (Galperin et al., 2025), whereas the original KOG dataset stems from earlier eukaryotic genome analyses with less frequent updates, though orthologous group concepts are now often accessed through expanded frameworks such as eggNOG (Hernández-Plaza et al., 2023). Understanding these differences is key when selecting appropriate functional annotation strategies—for example, when annotating prokaryotic metagenomes or eukaryotic transcriptomes, or comparing COG vs KOG difference in cross‑domain studies.
| Feature | COG (Clusters of Orthologous Groups) | KOG (Eukaryotic Orthologous Groups) |
|---|---|---|
| Target Organisms | Bacteria and Archaea (prokaryotes) | Eukaryotes (animals, plants, fungi) |
| Original Genome Count (Historical) | 66 prokaryotic genomes (original historic version) | 7 eukaryotic genomes (original KOG set) |
| Current Genome Coverage | ~2296 prokaryotic genomes (bacterial & archaeal genera with complete genomes) | Largely static from original set; no major recent formal updates, still based on model eukaryotes |
| Number of Clusters | ~5061 COGs (latest NCBI COG 2026) | ~4852 KOGs (original collection) |
| Protein Coverage in Source Genomes | ~72.5% of proteins across covered prokaryotes | ~54% of analyzed eukaryotic proteins (from original 7 genomes) |
| Functional Categories | COG has ~25 broad functional categories (e.g., metabolism, cellular processes, information storage) | KOG has similar broad functional letters extended with eukaryote-specific groups (e.g., intracellular trafficking) |
| Annotation Focus | Core metabolism, cellular processes, universal prokaryotic systems | Eukaryotic cellular complexity, signal transduction, multicellular processes |
| Update Frequency | Actively maintained and updated (last major NCBI release in 2024/25; ongoing incremental updates) | Stable / no major recent updates; largely based on original 2003 eukaryotic genome set |
| Typical Use Cases | Prokaryotic genome annotation, metagenomic functional annotation, comparative genomics, COG enrichment analysis | Functional annotation for eukaryotic gene sets, evolutionary analysis across model eukaryotes |
3. HOW COG AND KOG WORK: ORTHOLOGOUS GROUPING AND FUNCTIONAL ASSIGNMENT
The construction of COG and KOG relies on a set of core computational principles designed to distinguish orthologs from paralogs.
- Reciprocal Best Hits: For two proteins from different genomes to be considered orthologs, they must be each other's best match in a BLAST search. This reciprocal requirement eliminates many paralogous relationships, where a protein in genome A might have multiple highly similar matches in genome B.
- Clustering Methods: Pairwise comparisons are performed across all included genomes. Proteins that form a connected graph through reciprocal best hits are grouped into a single orthologous cluster, ensuring that each COG or KOG represents a set of proteins descended from a common ancestral gene with functional conservation expected across members.
- Annotation Propagation: Once a cluster is established, functional annotations from experimentally characterized members can be transferred to all other members of the same cluster. This principle underpins the utility of COG/KOG for annotating newly sequenced genomes.
- Limitations: Paralogs that remain in the same cluster due to high sequence conservation can lead to incorrect functional inference. Divergent evolution may result in genuine orthologs that no longer share detectable sequence similarity, causing omission from clusters. Additionally, incomplete genome assemblies can disrupt reciprocal best hit calculations, particularly for non-model organisms.
4. COG/KOG FUNCTIONAL ANNOTATION AND ENRICHMENT ANALYSIS WORKFLOW
Effective COG/KOG analysis relies on two connected steps: functional annotation and functional enrichment analysis. The first assigns genes or proteins to orthologous groups and COG functional categories, while the second evaluates which categories are significantly overrepresented in a target dataset. Together, these steps form a practical workflow for COG database and KOG database analysis in transcriptomics, proteomics functional analysis, and multi-omics studies.
4.1 Functional Annotation Workflow: From Sequences to Functional Labels
Functional annotation translates raw sequence data into structured biological insights, assigning proteins or genes to defined functional categories. This process typically involves four interconnected steps: input preparation, sequence alignment, extraction of annotation outputs, and the use of supporting tools to refine results.
Input Data: Protein sequences in FASTA format constitute the primary input. In proteomics studies, identified proteins from mass spectrometry can be submitted directly, whereas gene or transcript identifiers are converted to protein sequences when required. Preparing accurate input ensures downstream annotation faithfully represents the underlying molecular dataset.
Alignment Tools: Sequence similarity searches against the COG/KOG databases are central to functional assignment. Tools such as DIAMOND and BLASTP are widely used, with DIAMOND preferred for large datasets due to its computational speed while retaining sensitivity comparable to BLAST. High-quality alignments underpin reliable functional inference, reducing potential misannotation.
Annotation Output: Each sequence is assigned a COG or KOG identifier, a functional description, and a category letter (e.g., J for translation, K for transcription, C for energy production). Proteins with multiple biological roles may receive assignments to several categories, reflecting their participation in distinct cellular processes.
Supporting Tools: Advanced annotation platforms enhance both efficiency and coverage. eggNOG-mapper leverages the extended eggNOG database incorporating COG/KOG classifications for high-throughput analysis (Kim et al., 2024), WebMGA provides a user-friendly web interface for small datasets, and KEGG COG integrates functional annotation with pathway mapping and orthology analyses. Together, these tools facilitate robust and interpretable functional annotation across diverse genomic and proteomic datasets.

Figure 2. The workflow of EggNOG-mapper v2 consists of gene prediction, search, orthology inference, and annotation stages. Image reproduced from Kim et al., 2024, Journal of translational medicine, licensed under the Creative Commons Attribution 4.0 International License (CC BY 4.0).
4.2 Functional Enrichment Analysis: Identifying Biologically Significant Patterns
Functional enrichment analysis assesses whether particular functional categories occur more frequently in a test set than expected by chance, highlighting biological processes modulated under specific experimental conditions.
Statistical Methods: Enrichment is calculated using the hypergeometric distribution (Fisher's exact test), which compares the frequency of category assignments in the test set against a background. Multiple testing corrections, such as FDR or the Benjamini-Hochberg procedure, control for false positives, ensuring reliable identification of significantly enriched categories.
Result Interpretation: Functional categories with adjusted p-values below 0.05 and odds ratios greater than 1 are considered enriched. For example, enrichment in category J (translation) may indicate heightened protein synthesis, enrichment in category C (energy production) suggests metabolic activation, and enrichment in category T (signal transduction) reflects cellular responses to environmental or experimental stimuli. Interpreting enrichment requires considering biological context alongside statistical significance.
Visualization Options: Various graphical approaches enhance interpretability. Bubble plots depict both enrichment significance (via color gradients) and category counts (bubble size), bar charts display odds ratios with thresholds for significance, and circular COG distribution plots facilitate comparison of functional composition across experimental groups.
Complementary Evidence: While enrichment analyses provide statistical insights, their biological relevance is strengthened when integrated with complementary data, such as gene or protein expression levels, experimental validation, and known pathway interactions. Combining these perspectives ensures that observed enrichments highlight truly meaningful functional patterns rather than artifacts of data sampling or annotation biases.
5. COG/KOG APPLICATIONS IN COMPARATIVE GENOMICS AND MULTI-OMICS
COG and KOG databases play integral roles in modern bioinformatics, supporting functional annotation in genomics, comparative analyses across species, and interpretation of proteomics functional analysis and transcriptomics datasets. By leveraging their evolutionary classification of proteins, researchers can explore conserved and divergent functional patterns between taxa, uncover biologically meaningful insights from large‑scale molecular profiles, and integrate multi‑dimensional omics data into coherent biological narratives.
5.1 COG in Comparative Genomics: Uncovering Species-Specific Functional Adaptations
Comparative genomics studies leverage COG database annotations to identify functional differences between related species across ecological niches. A large-scale analysis of 4,366 bacterial pathogens from human, animal, and environmental sources revealed that human-associated Pseudomonadota exhibited significant enrichment in COG functional categories related to carbohydrate transport and metabolism, coenzyme metabolism, and mobilome elements (prophages, transposons), reflecting co-evolution with the human host (Zhang et al., 2025). Environmental isolates showed greater enrichment in metabolism and transcriptional regulation categories, demonstrating how COG functional categories distinguish niche-specific adaptation strategies.

Figure 3. Fold-change differences in COG categories based on gene counts among bacterial genomes from different hosts/niches within the same taxa. Image reproduced from Zhang et al., 2025, Frontiers in microbiology, licensed under the Creative Commons Attribution 4.0 International License (CC BY 4.0).
5.2 COG in Metagenomics: Profiling Microbial Community Functions
COG in metagenomics enables functional profiling of microbial communities independent of taxonomic composition. A shotgun metagenomic study of raw soy sauce fermentation used COG annotation via eggNOG to characterize phage auxiliary metabolic functions. COG functional categories revealed distinct patterns between fermentation types: Cantonese-type samples showed enrichment in carbohydrate metabolism (0.74%) and lipid metabolism (0.84%) categories, while Japanese-type samples had higher amino acid metabolism functions (0.12%) (Tan et al., 2023). Thirty auxiliary metabolism genes associated with carbohydrate utilization and amino acid biosynthesis were identified, demonstrating how COG functional categories reveal phage-encoded metabolic capabilities.
 of proteins_1776051099_WNo_1228d364.webp "Annotated metabolic functions of phages belonging to the Clusters of Orthologous Groups (COG) of proteins")
Figure 4. Annotated metabolic functions of phages belonging to the Clusters of Orthologous Groups (COG) of proteins. Image reproduced from Tian et al., 2023, Frontiers in microbiology, licensed under the Creative Commons Attribution 4.0 International License (CC BY 4.0).
5.3 KOG in Proteomics: Functional Characterization of Disease Mechanisms
Quantitative proteomics functional analysis integrates COG database annotation to interpret differentially expressed proteins in disease pathology. A DIA-MS proteomic study of intrahepatic cholestasis of pregnancy (10 patients vs. 10 controls) mapped placental proteins to COG functional categories, revealing significant enrichment in coenzyme transport and metabolism pathways alongside autophagy and JAK-STAT signaling (Fang et al., 2022). This functional annotation approach identified core differentially expressed proteins—HBG1, SPI1, FOXK1, and SLC13A3—as potential biomarkers, demonstrating how COG/KOG annotation provides mechanistic insights into disease-associated protein expression changes.

Figure 5. KOG enrichment analysis of ICP differentially expressed proteins. Image reproduced from Fang et al., 2022, Frontiers in cell and developmental biology, licensed under the Creative Commons Attribution 4.0 International License (CC BY 4.0).
6. LIMITATIONS AND ADVANCED STRATEGIES IN COG/KOG FUNCTIONAL ANNOTATION
Although the COG and KOG databases remain fundamental resources for functional annotation, their limitations must be considered to ensure comprehensive and accurate interpretation. The original databases were constructed from a relatively small set of genomes—66 prokaryotic genomes for COG and 7 eukaryotic genomes for KOG. As a result, highly divergent proteins, lineage-specific expansions, and novel protein families may lack representation, leaving a significant portion of sequences unclassified. For example, KOG coverage encompasses approximately 54% of proteins in the analyzed genomes, highlighting gaps in functional annotation. Additionally, the original NCBI-maintained COG/KOG resources are no longer actively updated, which can challenge studies involving recently sequenced organisms or emerging protein families, particularly in multi-omics applications where comprehensive functional context is essential.
To address these limitations, researchers can adopt advanced strategies that extend coverage and enhance functional resolution. One approach is integration with the eggNOG database, which builds upon the COG/KOG framework, extending orthology relationships to thousands of genomes while maintaining compatibility with original functional categories. Tools such as eggNOG-mapper facilitate direct annotation using this expanded resource. Another effective strategy involves multi-database joint annotation, combining complementary resources to achieve a more complete functional perspective. Key components of this approach include:
- COG/KOG: Broad orthology-based classification for evolutionary and functional inference
- KEGG: Pathway-level context for metabolic and signaling processes
- GO (Gene Ontology): Structured, granular functional terms across molecular functions, biological processes, and cellular components
- Pfam: Identification of conserved protein domains for mechanistic insights
By applying these strategies, researchers can achieve comprehensive functional annotation, particularly for non-model organisms or in multi-omics projects where integration across multiple functional dimensions enhances the interpretability and biological relevance of the results.
MetwareBio: Functional Annotation Support for Multi-Omics Research
As discussed above, COG/KOG annotation is most informative when combined with complementary resources such as eggNOG, GO, KEGG, and domain-level analysis. MetwareBio provides integrated bioinformatics support for proteomics, metabolomics, transcriptomics, metagenomics, and multi-omics studies, helping researchers translate complex omics datasets into clear and reliable functional insights.
For projects requiring functional annotation, enrichment analysis, or multi-omics interpretation, contact MetwareBio to discuss a workflow tailored to your research goals.
Contact UsReferences
- Galperin, M. Y., Wolf, Y. I., Makarova, K. S., Vera Alvarez, R., Landsman, D., & Koonin, E. V. (2021). COG database update: focus on microbial diversity, model organisms, and widespread pathogens. Nucleic acids research, 49(D1), D274–D281. https://doi.org/10.1093/nar/gkaa1018
- Hernández-Plaza, A., Szklarczyk, D., Botas, J., Cantalapiedra, C. P., Giner-Lamia, J., Mende, D. R., Kirsch, R., Rattei, T., Letunic, I., Jensen, L. J., Bork, P., von Mering, C., & Huerta-Cepas, J. (2023). eggNOG 6.0: enabling comparative genomics across 12 535 organisms. Nucleic acids research, 51(D1), D389–D394. https://doi.org/10.1093/nar/gkac1022
- Tatusov, R. L., Koonin, E. V., & Lipman, D. J. (1997). A genomic perspective on protein families. Science (New York, N.Y.), 278(5338), 631–637. https://doi.org/10.1126/science.278.5338.631
- Tatusov, R. L., Fedorova, N. D., Jackson, J. D., Jacobs, A. R., Kiryutin, B., Koonin, E. V., Krylov, D. M., Mazumder, R., Mekhedov, S. L., Nikolskaya, A. N., Rao, B. S., Smirnov, S., Sverdlov, A. V., Vasudevan, S., Wolf, Y. I., Yin, J. J., & Natale, D. A. (2003). The COG database: an updated version includes eukaryotes. BMC bioinformatics, 4, 41. https://doi.org/10.1186/1471-2105-4-41
- Galperin, M. Y., Vera Alvarez, R., Karamycheva, S., Makarova, K. S., Wolf, Y. I., Landsman, D., & Koonin, E. V. (2025). COG database update 2024. Nucleic acids research, 53(D1), D356–D363. https://doi.org/10.1093/nar/gkae983
- Kim, C., Pongpanich, M., & Porntaveetus, T. (2024). Unraveling metagenomics through long-read sequencing: a comprehensive review. Journal of translational medicine, 22(1), 111. https://doi.org/10.1186/s12967-024-04917-1
- Zhang, M., Han, L., Liao, C., Su, W., & Jiang, C. (2025). Comparative genomics reveals key adaptive mechanisms in pathogen host-niche specialization. Frontiers in microbiology, 16, 1543610. https://doi.org/10.3389/fmicb.2025.1543610
- Tan, G., Qi, S., Wang, Y., Li, X., Li, X., Li, M., Li, L., Zhao, L., & Hu, M. (2023). Uncovering differences in the composition and function of phage communities and phage-bacterium interactions in raw soy sauce. Frontiers in microbiology, 14, 1328158. https://doi.org/10.3389/fmicb.2023.1328158
- Fang, D., Fang, Y., Zhang, W., Xiang, Y., Cheng, X., Liang, M., & Xia, H. (2022). Comprehensive Analysis of Quantitative Proteomics With DIA Mass Spectrometry and ceRNA Network in Intrahepatic Cholestasis of Pregnancy. Frontiers in cell and developmental biology, 10, 854425. https://doi.org/10.3389/fcell.2022.854425
