Gene-level differential analysis is often only the first step in interpreting transcriptomic or proteomic data. Researchers may need to determine whether a biological program is associated with a treatment contrast, quantify a signature in every patient, track a pathway-oriented pattern across time points, or connect molecular programs with clinical and metabolomic variables. These goals sound similar, but they require different analytical outputs.
Gene set enrichment analysis (GSEA), single-sample GSEA (ssGSEA), and gene set variation analysis (GSVA) all summarize molecular profiles with predefined gene sets. However, GSEA evaluates enrichment for a contrast or ranked phenotype association, whereas ssGSEA and GSVA produce gene-set-by-sample score matrices for downstream modeling. Moreover, a gene set may represent a canonical pathway, an immune signature, a cell state, or an experimentally defined program. Therefore, a gene-set score should be interpreted as an expression-derived summary rather than direct biochemical activity.
1. What Is GSEA? Contrast-Level Enrichment from Ranked Gene Lists
GSEA is designed to test whether members of a predefined gene set accumulate near the top or bottom of a ranked list of genes. The ranking may be created directly from an expression matrix and phenotype labels in standard GSEA, or supplied as a preranked statistic in GSEAPreranked. In both cases, the analytical unit is a contrast, phenotype association, or ranked statistic rather than an individual sample (Subramanian et al., 2005).
The method walks down the ranked list, increasing a running-sum statistic when a gene belongs to the set and decreasing it when the gene is outside the set. The maximum deviation from zero defines the enrichment score (ES). Normalization against an appropriate null distribution produces the normalized enrichment score (NES), while nominal p-values and false discovery rate (FDR) estimates describe statistical evidence. Leading-edge genes identify the subset that contributes most strongly to the enrichment signal.
The null model must match the study design. Phenotype-label permutation is preferred when sample size and exchangeability are adequate because it preserves gene-gene correlations. GSEAPreranked instead uses gene-set permutation, which represents a different null model and should be reported explicitly. Ties, duplicate identifiers, incomplete ranked lists, and one-sided metrics can also distort enrichment results. A transparent ranking statistic, an adequately large number of permutations for the intended p-value resolution, and explicit reporting of the permutation framework are therefore essential for reproducible interpretation. Additional implementation details are available in the official GSEA User Guide.
GSEA is especially useful when many genes change modestly but coherently, because it avoids defining biology only from genes that pass an arbitrary differential-expression cutoff. Its main limitation is equally important: the NES and FDR describe a specific contrast or ranking. They are not per-sample measurements and should not be interpreted as absolute pathway activity. A broader introduction is available in the MetwareBio GSEA enrichment analysis guide.
2. What Is ssGSEA? Sample-Level Gene-Set Scoring
ssGSEA adapts the enrichment concept to calculate one score for every sample-gene set pair. Within each sample, features are ranked by expression or abundance. The algorithm then compares the empirical cumulative distributions of genes inside and outside the selected gene set, producing a relative enrichment score for that sample (Barbie et al., 2009; Castelo et al., 2026).
The resulting gene-set-by-sample matrix can be used as a lower-dimensional feature space for patient stratification, clustering, longitudinal analysis, survival modeling, and association with continuous phenotypes. This makes ssGSEA useful when the research question concerns heterogeneity among individuals rather than only the average difference between predefined groups.
Score generation is not the same as significance testing. A high score in one sample does not establish a group difference, prognostic association, or causal mechanism. Those questions require downstream statistical models, covariate adjustment, multiple-testing correction, and independent validation. In addition, score ranges can change with the ranking weight, gene-set composition, normalization step, software implementation, and preprocessing pipeline. Raw ssGSEA values should therefore be interpreted within a documented analysis context rather than as universal measurement units.
3. What Is GSVA? Cohort-Informed Sample-Level Gene-Set Scoring
GSVA transforms a gene-by-sample expression matrix into a gene-set-by-sample matrix without using phenotype labels during the initial transformation. It first estimates expression distributions across the analyzed samples, then applies a rank-based random-walk procedure to summarize the relative expression of each gene set in each sample (Hänzelmann et al., 2013). The resulting matrix can be analyzed with familiar tools for differential testing, clustering, classification, survival analysis, or correlation.
Because the expression-distribution step uses the sample cohort, GSVA scores are influenced by cohort composition, input scale, and parameter settings. This differs from a purely within-sample interpretation and becomes important when scores are transferred across studies or generated after adding or removing samples. Consistent preprocessing and external validation are therefore necessary for cross-cohort applications (Foroutan et al., 2018; Toro-Domínguez et al., 2025).
The GSVA algorithm should also be distinguished from the Bioconductor GSVA package. The package implements GSVA, ssGSEA, PLAGE, and z-score methods; selecting ssGSEA within the package does not make ssGSEA and GSVA the same algorithm (Castelo et al., 2026). Like ssGSEA, GSVA produces an expression-derived relative score rather than a direct biochemical measurement.
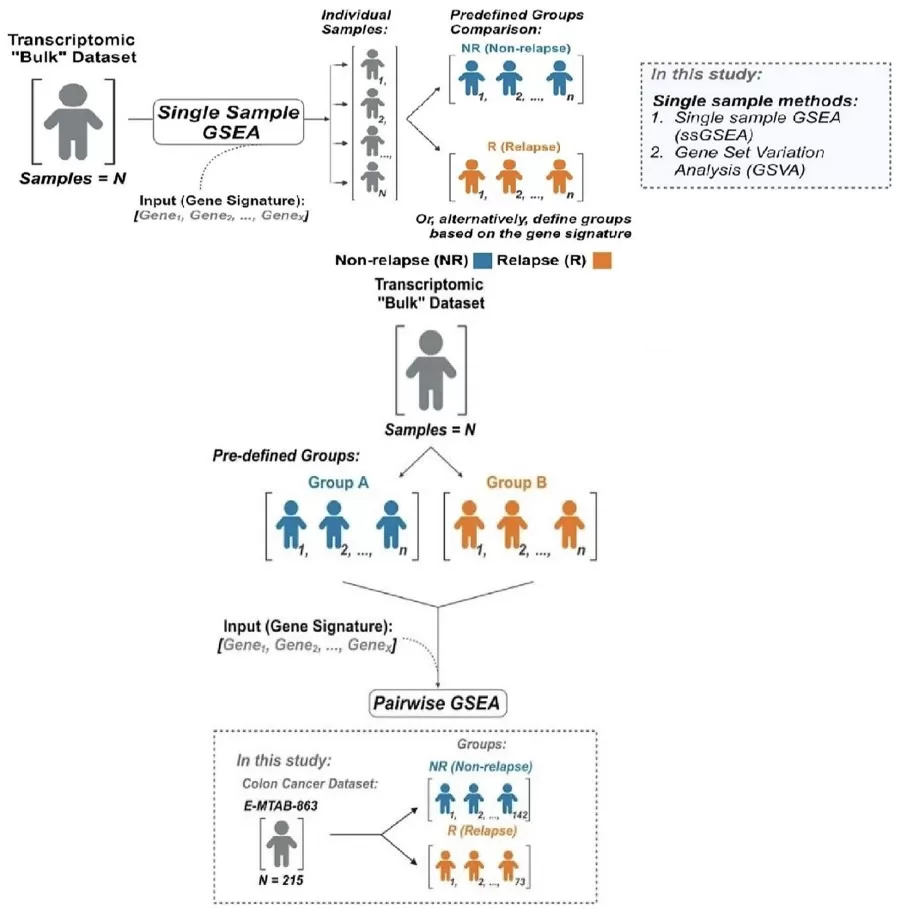
Figure 1. Pairwise and single-sample gene-set analysis workflows. Pairwise GSEA begins with differential expression analysis and gene ranking to generate contrast-level enrichment results, whereas ssGSEA and GSVA generate sample-level gene-set scores for downstream comparison and modeling. Adapted from Bull et al. (2024), Figures 1A and 2A, under CC BY 4.0.
4. GSEA vs ssGSEA vs GSVA: Key Differences and Outputs
All three methods depend on predefined gene sets, but they differ in the question asked, the unit analyzed, and the statistical meaning of the output. GSEA evaluates enrichment for a specified contrast or ranking. ssGSEA and GSVA create continuous sample-level features that normally require a separate downstream model. ssGSEA emphasizes the rank distribution within each sample, whereas GSVA additionally estimates expression distributions across the sample cohort.
Table 1. GSEA vs ssGSEA vs GSVA: Analytical Questions, Inputs, Outputs, and Use Cases
| Comparison dimension | GSEA | ssGSEA | GSVA |
|---|---|---|---|
| Primary question | Which gene sets are enriched for a contrast, phenotype, or ranked statistic? | What relative enrichment score does a gene set receive within each sample? | How does gene-set expression vary across a sample cohort? |
| Analytical unit | Contrast, phenotype association, or preranked statistic | Individual sample | Sample-level score estimated from a cohort expression matrix |
| Phenotype labels | Often define the contrast or ranking | Not required to generate scores; used downstream | Not required to generate scores; used downstream |
| Typical input | Expression matrix plus labels, or a ranked gene list | Appropriately processed gene-by-sample matrix | Gene-by-sample matrix matched to the selected distribution setting |
| Core calculation | Weighted running-sum statistic over a ranked list plus a null model | Within-sample ranks and member versus non-member empirical distributions | Cross-sample expression-distribution transformation followed by sample-level random-walk scoring |
| Main output | ES, NES, nominal p-value, FDR, leading-edge genes | Gene-set-by-sample score matrix | Gene-set-by-sample score matrix |
| Where significance is assessed | Within the enrichment framework | In a downstream statistical model | In a downstream statistical model |
| Cohort dependence | Depends on ranking, contrast, permutations, and gene-set collection | Core ranking is sample based, but normalization and implementation can add dataset dependence | Expression-distribution estimation explicitly uses the sample cohort |
| Typical applications | Differential enrichment and phenotype-associated biology | Signature scoring, heterogeneity, stratification, clustering | Pathway-oriented differential analysis, clustering, prognosis, correlation |
| Main limitation | No direct score for every sample | Scores depend on ranking, normalization, implementation, and gene-set composition | Scores depend on cohort composition, distribution assumptions, parameters, and gene-set composition |
| Common misinterpretation | Treating NES as absolute pathway activity | Treating raw scores as universally comparable values | Treating expression-derived scores as biochemical activity or causal evidence |
GSEA tests enrichment for a defined contrast or ranking, whereas ssGSEA and GSVA transform molecular profiles into sample-level gene-set features for downstream analysis.
5. How to Choose Between GSEA, ssGSEA, and GSVA
Method selection should begin with the biological question and the required unit of inference, not with the software package that is most familiar.
5.1 Use GSEA for Differential Enrichment and Phenotype Associations
GSEA is the clearest choice when the primary objective is to identify biological programs associated with treatment versus control, mutant versus wild type, responder versus non-responder, or a continuous phenotype. It is particularly informative when coordinated shifts are distributed across many genes and a hard differentially expressed gene cutoff would discard relevant signal. For complex experimental designs, the ranked list should usually be generated from an appropriate statistical model, using a signed test statistic that reflects both direction and evidence rather than fold change alone. Ranking metrics and permutation choices are discussed in the official GSEA User Guide. A complementary comparison with threshold-based enrichment is provided in ORA vs GSEA: Choosing the Right Pathway Enrichment Method.
5.2 Use ssGSEA or GSVA for Sample-Level Heterogeneity
ssGSEA or GSVA is more suitable when every sample needs a gene-set feature. Common objectives include molecular subtyping, immune or cell-state signature scoring, longitudinal monitoring, prognosis, and correlation with metabolites, proteins, or clinical variables. The score matrix can enter linear models, mixed models, Cox models, classifiers, or unsupervised analyses. Downstream models should still reflect the study design, covariates, and validation strategy.
5.3 Choose Between ssGSEA and GSVA Based on Scoring Logic
ssGSEA is often attractive when a rank-based description within each sample is the conceptual priority. GSVA is useful when the objective is to transform a cohort expression matrix into gene-set-level features that retain between-sample variation. Neither algorithm is universally superior. Performance and reproducibility depend on the data distribution, cohort size and composition, signature properties, preprocessing, and downstream task (Rahmatallah et al., 2016; Toro-Domínguez et al., 2025).
For cross-study prediction or clinical translation, raw scores should not be treated as directly portable. Harmonized preprocessing, gene-set definitions, software versions, parameters, and external validation remain essential (Foroutan et al., 2018; Toro-Domínguez et al., 2025). When conclusions depend strongly on one scoring method, sensitivity analysis across reasonable methods and gene-set collections is more informative than selecting an algorithm only because it is familiar. In Figure 2, supervised refers to methods that use known phenotype labels, whereas unsupervised refers to sample-level score generation without labels. Competitive methods compare a gene set with genes outside the set, whereas self-contained methods test only the genes within the set.
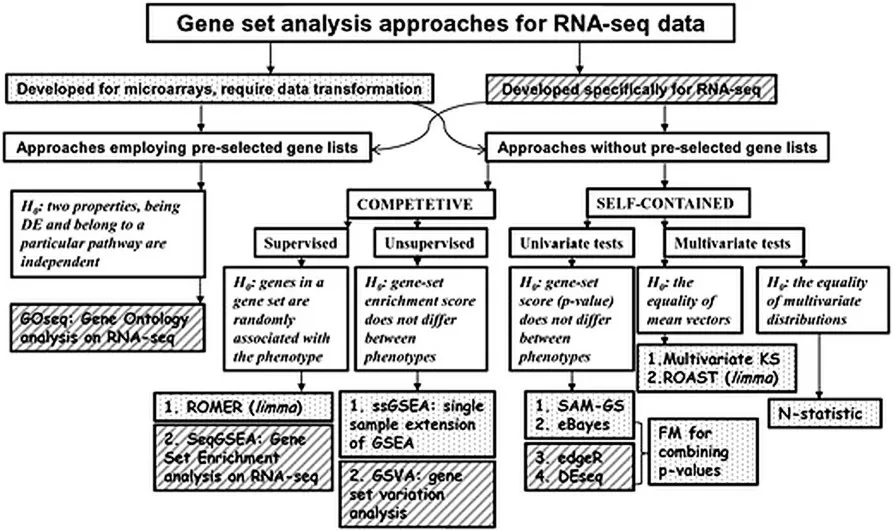
Figure 2. Statistical classification of gene set analysis methods. GSEA is represented as a supervised competitive approach, whereas GSVA and ssGSEA are represented as unsupervised competitive approaches that generate sample-level enrichment scores. Reproduced from Rahmatallah et al. (2016), Figure 1, under CC BY 4.0.
6. A Practical Workflow for GSEA, ssGSEA, and GSVA
A reliable workflow connects study design, data preparation, gene-set curation, method configuration, downstream statistics, and reporting. Each stage can alter the biological meaning of the final result.
6.1 Convert the Study Design into an Analysis Plan
Define the main contrast, continuous phenotype, repeated-measure structure, sample size, expected covariates, and downstream use before running enrichment or scoring. Convert the objective into an executable question: test differential enrichment, generate per-sample features, stratify patients, predict an outcome, or integrate with another omics layer. Predefining the statistical unit and validation strategy reduces the risk of generating many scores and then searching retrospectively for a favorable association.
6.2 Prepare a Method-Compatible Input Matrix
Quality control should address low-quality samples, batch effects, low-information or constant features, and the scale required by the chosen implementation. Standard GSEA can use an expression matrix with phenotype labels, whereas GSEAPreranked accepts a complete ranked list. ssGSEA generally uses an appropriately normalized continuous matrix. GSVA is commonly applied to normalized continuous values, while its implementation can also use a Poisson kernel for integer counts; the data scale and kernel choice must be reported (Castelo et al., 2026).
Proteomic applications require additional attention to missingness, imputation, protein coverage, and identifier conversion. Single-cell data should not be treated as a smaller version of bulk data: sparsity, variable detected-gene counts, cell-type composition, and computational scale can bias methods developed for bulk profiles. Dedicated single-cell scoring approaches or carefully benchmarked adaptations may be preferable (Noureen et al., 2022).
6.3 Match Feature IDs and Curate Gene Sets
Expression features and gene sets must use compatible identifiers. Mixing Ensembl IDs, Entrez IDs, and gene symbols without a documented mapping step can remove a large fraction of gene-set members. Record the database, organism, release, identifier type, and any ortholog conversion. Gene sets may come from MSigDB, GO, KEGG, Reactome, or a curated experimental signature, but the biological interpretation must match the set definition (Castelo et al., 2026).
Check the number of mapped genes per set and apply defensible minimum and maximum sizes. Highly overlapping sets can produce redundant findings and complicate interpretation. Directional UP and DOWN signatures should not be merged into a directionally ambiguous gene set unless the selected scoring framework explicitly models them as separate components. Because gene sets encode membership rather than every molecular interaction, pathway names should not be treated as complete mechanistic models (Castelo et al., 2026). For a broader overview of annotation and enrichment resources, see GO vs KEGG vs GSEA: How to Choose the Right Enrichment Analysis?
6.4 Configure Parameters and Downstream Statistics
For GSEA, document the ranking metric, ranking direction, standard versus preranked workflow, permutation strategy, number of permutations, gene-set size limits, NES, FDR, and leading-edge genes. For ssGSEA, record the ranking weight or tau, score normalization, missing-value strategy, and implementation. For GSVA, report the distribution setting such as kcdf, tau, maxDiff, absRanking, sparse computation, and software version.
After ssGSEA or GSVA scoring, analyze the score matrix with a model that reflects the design. This may include linear models for group comparisons, mixed models for repeated samples, Cox models for survival, or partial correlation and multivariable regression for multi-omics associations. Batch, tissue composition, immune-cell abundance, age, sex, treatment, and other clinical variables should be considered when biologically relevant.
6.5 Report the Analysis for Reproducibility
A reproducible report should include the preprocessing sequence, input scale, software and package versions, parameter objects, random seed where applicable, gene-set source and release, identifier type, filtering rules, mapped coverage, statistical model, covariates, multiple-testing correction, and validation plan. These details are not administrative extras: changes in cohort composition, gene-set definitions, or software defaults can change sample scores and ranked enrichment results.
Figure 3 illustrates one robustness-oriented implementation of gene-set analysis. In this example, bootstrap resampling and rank aggregation are used to assess the stability of enrichment findings within and across transcriptomic and proteomic datasets.
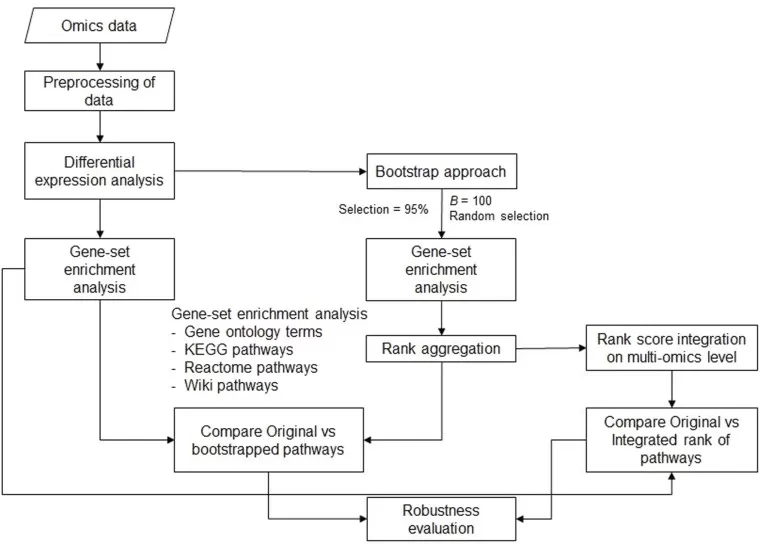
Figure 3. Bootstrap-based gene set enrichment and rank-aggregation workflow for single- and multi-omics analyses. Reproduced from Hemandhar Kumar et al. (2024), Figure 1, under CC BY 4.0.
7. Interpreting and Validating GSEA, ssGSEA, and GSVA Results
The same biological label can appear in outputs with very different statistical meanings. Interpretation should therefore begin with the type of output, then consider score dependence, confounding, and the evidence needed for validation.
GSEA Significance Is Not a Sample-Level Score
GSEA produces contrast-level enrichment statistics. Its NES, nominal p-value, and FDR belong to a defined ranking and null model. ssGSEA and GSVA first produce continuous scores for each sample; significance is assessed only after those scores enter an appropriate downstream model. Consequently, a sample with a high score is not automatically associated with treatment response or survival, and an NES should not be inserted into a patient-level model as though it were a sample measurement.
Gene-Set Scores Are Relative and Method-Dependent
ssGSEA and GSVA scores are not numerically interchangeable. Even within one method, preprocessing, parameters, software versions, cohort composition, and gene-set definitions can alter the range and ordering of scores. Cross-cohort comparisons require a consistent pipeline, calibration, and independent performance assessment. Score direction also depends on gene-set construction: a coherent UP signature may support a higher-is-more interpretation, whereas a set containing both activators and inhibitors may not (Foroutan et al., 2018; Toro-Domínguez et al., 2025).
Higher Scores Do Not Prove Pathway Activation
Expression-derived gene-set scores summarize coordinated abundance patterns. They do not directly demonstrate enzymatic flux, phosphorylation-dependent signaling, metabolite turnover, or causality. In bulk tissue, an immune signature may rise because immune cells are more abundant rather than because the same pathway is activated within every cell. Strong interpretation therefore combines score-level statistics with leading-edge or contributing genes, differential proteins, phosphoproteins, metabolites, clinical variables, and experimental validation.
Common High-Risk Errors
Wrong analytical question. Using classic GSEA when per-sample features are required, or comparing raw single-sample scores without a model when the real objective is a contrast-level test.
Mismatched preprocessing. Using an input scale that does not match the algorithm, leaving strong batch effects uncontrolled, or applying an unexamined imputation strategy to proteomics data.
Poor identifier mapping and coverage. Scoring a set after most members fail to map, without reporting the effective gene-set size.
Redundant or directionally ambiguous gene sets. Presenting many overlapping terms as independent discoveries or merging UP and DOWN signatures into a set with unclear direction.
Cross-method or cross-cohort score comparison. Treating GSVA and ssGSEA values as a common unit or comparing raw scores from independently processed cohorts.
Circular signature construction. Selecting genes, building a signature, scoring samples, and validating the signature in the same dataset, creating data leakage and optimistic performance.
Table 2. How to Interpret GSEA, ssGSEA, and GSVA Outputs
| Output | What it supports | What it does not prove | Recommended validation |
|---|---|---|---|
| GSEA ES/NES | Enrichment direction and relative strength in a defined contrast | Absolute activity in an individual sample | Review FDR, ranking statistic, leading edge, and independent data |
| GSEA p-value/FDR | Statistical evidence in the specified enrichment framework | Causality or biological effect size by itself | Report NES, FDR, gene-set size, permutations, and core genes |
| ssGSEA score | A sample-level signature or gene-set feature | A universal cross-cohort absolute value | Use a consistent pipeline, downstream model, sensitivity analysis, and external validation |
| GSVA score | A feature for differential, clustering, survival, or correlation analysis | Direct enzyme activity, metabolic flux, or causal pathway activation | Combine downstream statistics with protein, metabolite, phenotype, and experimental evidence |
8. From Gene-Set Scores to Multi-Omics Interpretation
Gene-set analysis becomes more informative when it is used to organize, rather than replace, evidence from multiple molecular layers. Transcriptomic scores can be compared with protein abundance, phosphoproteomic regulation, metabolite concentrations, microbiome features, and clinical phenotypes. Agreement across layers can strengthen a mechanistic hypothesis, while discordance may reveal post-transcriptional control, enzyme regulation, substrate limitation, tissue composition, or time-lagged responses.
For multi-omics modeling, gene-set scores can serve as compact transcriptomic or proteomic features in regression, network, or correlation analyses. Confounders and repeated measures should remain part of the statistical model. Ordinary metabolite matrices should not be entered into gene-based ssGSEA or GSVA as though metabolite identifiers were gene identifiers. Metabolomics is generally better handled with metabolite-set enrichment, pathway topology analysis, or a purpose-built cross-omics mapping framework.
A practical evidence chain may begin with GSEA to identify contrast-level programs, use ssGSEA or GSVA to quantify heterogeneity, connect those scores with proteins and metabolites, and then validate key mechanisms experimentally. This layered strategy preserves the statistical meaning of each method while moving from association toward biological explanation. Related cross-layer association strategies are discussed in the Multi-Omics Correlation Analysis Guide.
Frequently Asked Questions About GSEA, ssGSEA, and GSVA
Is ssGSEA the same as GSVA?
No. Both generate sample-level gene-set scores and can be run through the Bioconductor GSVA package, but they use different calculations. ssGSEA emphasizes within-sample rank distributions, whereas GSVA first estimates expression distributions across the sample cohort.
Can ssGSEA or GSVA be used for proteomics data?
Yes, with appropriate preprocessing. Protein-level abundance matrices can be scored after normalization, aggregation, and compatible gene identifier mapping. However, peptide-, isoform-, proteoform-, and modification-site-level information may be lost when features are collapsed to genes, so the aggregation strategy, missingness, imputation, and effective gene-set coverage should be reported.
Are ssGSEA and GSVA scores comparable across datasets?
Raw scores are generally not directly comparable across independently processed datasets. Consistent preprocessing, gene-set versions, software, and parameters are required, together with calibration, batch assessment, and external validation.
Build a Study-Specific Gene-Set Analysis Strategy
Move from gene-level changes to biologically interpretable gene-set patterns with a study-specific enrichment and multi-omics analysis strategy. MetwareBio supports omics data processing, pathway-level analysis and interpretation, and cross-omics integration across transcriptomic, proteomic, and metabolomic research.
Contact UsRead More
Explore these related articles on enrichment analysis, pathway interpretation, and statistical methods to build a comprehensive gene-set analysis strategy for your omics research.
A foundational guide to GSEA principles, implementation, and interpretation, complementing the contrast-level vs sample-level distinctions discussed in this article.
Compare threshold-based ORA with rank-based GSEA to select the appropriate enrichment method for your biological question and data type.
A practical tutorial on GO enrichment analysis using clusterProfiler, covering GeneRatio, BgRatio, p-value, and FDR interpretation for pathway-level insights.
Understand Weighted Gene Co-expression Network Analysis, a complementary approach for identifying gene modules and connecting them with sample-level traits.
Learn how to interpret volcano plots for differential analysis, an upstream step that generates the ranked gene lists used in GSEA and other enrichment methods.
A guide to normality testing methods that inform preprocessing and distribution assumptions relevant to gene-set scoring and downstream statistical models.
References
- Barbie, D. A., Tamayo, P., Boehm, J. S., et al. (2009). Systematic RNA interference reveals that oncogenic KRAS-driven cancers require TBK1. Nature, 462(7269), 108-112. https://doi.org/10.1038/nature08460
- Bull, C., Byrne, R. M., Fisher, N. C., et al. (2024). Dual gene set enrichment analysis (dualGSEA); an R function that enables more robust biological discovery and pre-clinical model alignment from transcriptomics data. Scientific Reports, 14, 30202. https://doi.org/10.1038/s41598-024-80534-8
- Castelo, R., Klenk, A., & Guinney, J. (2026). GSVA: Gene set variation analysis (Version 2.6.3) [Bioconductor package vignette]. Retrieved July 20, 2026, from https://bioconductor.org/packages/release/bioc/vignettes/GSVA/inst/doc/GSVA.html
- Foroutan, M., Bhuva, D. D., Lyu, R., Horan, K., Cursons, J., & Davis, M. J. (2018). Single sample scoring of molecular phenotypes. BMC Bioinformatics, 19, 404. https://doi.org/10.1186/s12859-018-2435-4
- Hänzelmann, S., Castelo, R., & Guinney, J. (2013). GSVA: Gene set variation analysis for microarray and RNA-seq data. BMC Bioinformatics, 14, 7. https://doi.org/10.1186/1471-2105-14-7
- Hemandhar Kumar, S., Tapken, I., Kuhn, D., Claus, P., & Jung, K. (2024). bootGSEA: A bootstrap and rank aggregation pipeline for multi-study and multi-omics enrichment analyses. Frontiers in Bioinformatics, 4, 1380928. https://doi.org/10.3389/fbinf.2024.1380928
- Noureen, N., Ye, Z., Chen, Y., Wang, X., & Zheng, S. (2022). Signature-scoring methods developed for bulk samples are not adequate for cancer single-cell RNA sequencing data. eLife, 11, e71994. https://doi.org/10.7554/eLife.71994
- Rahmatallah, Y., Emmert-Streib, F., & Glazko, G. (2016). Gene set analysis approaches for RNA-seq data: Performance evaluation and application guideline. Briefings in Bioinformatics, 17(3), 393-407. https://doi.org/10.1093/bib/bbv069
- Subramanian, A., Tamayo, P., Mootha, V. K., et al. (2005). Gene set enrichment analysis: A knowledge-based approach for interpreting genome-wide expression profiles. Proceedings of the National Academy of Sciences of the United States of America, 102(43), 15545-15550. https://doi.org/10.1073/pnas.0506580102
- Toro-Domínguez, D., Wang, C., Ellson-Lancho, I., et al. (2025). Benchmarking single-sample gene set scoring methods for application in precision medicine. Briefings in Bioinformatics, 26(6), bbaf684. https://doi.org/10.1093/bib/bbaf684