
Omics data analysis often begins with a practical statistical question: which test should be used to identify meaningful molecular differences between groups? In metabolomics, lipidomics, proteomics, post-translational modification studies, and transcriptomics, datasets are often high-dimensional, partially skewed, and affected by biological variability, missing values, outliers, and batch effects. Parametric and nonparametric tests are both used in differential feature analysis, but they rely on different assumptions and answer slightly different statistical questions. This article explains the difference between parametric and nonparametric tests in omics, when each approach is typically used, and how statistical results can be interpreted together with FDR correction, fold change, biological context, and validation.
1. WHAT ARE PARAMETRIC TESTS IN OMICS?
Parametric tests are statistical methods that rely on assumptions about the data-generating process. In simple comparisons, these assumptions often involve the distribution of measurements, the equality or inequality of variances, the independence of observations, or the behavior of residuals in a statistical model. In omics research, parametric testing is often applied after appropriate preprocessing, normalization, and transformation.
1.1 Common Parametric Tests Used in Omics
Common parametric tests and models include:
- Student's t-test: Used to compare two independent groups when approximate normality and similar variance are reasonable assumptions.
- Welch's t-test: Used to compare two independent groups when group variances may differ.
- Paired t-test: Used for matched or repeated measurements from the same biological units.
- Analysis of variance (ANOVA): Used to compare three or more groups under a parametric framework.
- Linear models: Used for study designs involving covariates, batch effects, multiple factors, continuous predictors, or interaction terms.
- Generalized statistical models: Used when the data type requires a specific distributional framework, such as negative binomial models for RNA-seq count data.
In high-throughput biology, parametric analysis is not limited to simple t-tests or ANOVA. For example, limma uses linear modeling and empirical Bayes moderation to support differential expression analysis across microarray and RNA-seq workflows, especially when variance estimation is difficult in small-sample datasets (Ritchie et al., 2015). DESeq2 models RNA-seq count data using a negative binomial framework and applies moderated estimation of fold change and dispersion, illustrating why platform-specific parametric models can be more appropriate than simple feature-by-feature tests for sequencing data (Love et al., 2014).
1.2 Use Cases and Key Considerations for Parametric Tests
Parametric tests are often useful when omics data have been appropriately normalized, transformed, and quality-controlled. In metabolomics, proteomics, and lipidomics, parametric tests are commonly applied to log-transformed abundance matrices when group comparisons are relatively simple and assumptions are reasonably supported. These methods can provide strong statistical power and clear effect estimates when the model structure fits the data.
Parametric approaches are also valuable when experimental designs include covariates, batch effects, blocking factors, time points, or continuous predictors. In these cases, linear models, mixed-effects models, or platform-specific models are often more suitable than simple two-group tests. However, the choice should not be mechanical. Data preprocessing can strongly influence downstream statistical results, and centering, scaling, and transformation may affect the biological information extracted from metabolomics datasets (van den Berg et al., 2006). Therefore, parametric tests should be selected according to study design, data distribution, variance behavior, and the type of omics platform.
2. WHAT ARE NONPARAMETRIC TESTS IN OMICS?
Nonparametric tests are statistical methods that make fewer assumptions about the exact distribution of the data. Many common nonparametric tests are based on ranks rather than raw abundance values. Instead of comparing means directly, rank-based tests evaluate whether observations from one group tend to be larger or smaller than observations from another group.
2.1 Common Nonparametric Tests Used in Omics
Common nonparametric tests include:
- Mann–Whitney U test / Wilcoxon rank-sum test: Used to compare two independent groups when rank-based comparison is more appropriate than mean-based comparison.
- Wilcoxon signed-rank test: Used for paired or matched comparisons when within-pair differences are not well suited for a paired t-test.
- Kruskal–Wallis test: Used to compare three or more independent groups as a nonparametric alternative to one-way ANOVA.
- Friedman test: Used for repeated-measures or blocked designs with three or more conditions.
- Permutation tests: Used to estimate statistical significance by repeatedly rearranging group labels under a null hypothesis.
2.2 Use Cases and Key Considerations for Nonparametric Tests
Nonparametric tests can be useful when omics data are strongly skewed, contain outliers, are ordinal, or remain poorly suited for parametric assumptions after normalization and transformation. In small exploratory studies, they may also be considered when distributional assumptions are difficult to justify, although limited sample size remains a challenge for any statistical method.
However, nonparametric does not mean assumption-free. Rank-based tests still require the correct independence, pairing, or blocking structure. A Mann–Whitney U test, for example, should not be interpreted simply as a test of mean differences; it is sensitive to rank-based distributional differences, and differences in spread or shape can influence the result. Nonparametric tests may also have lower statistical power than parametric tests when parametric assumptions are reasonably met. In studies involving covariates, batch effects, repeated measures, or complex experimental designs, model-based methods may be more appropriate than simple rank-based tests.
3. PARAMETRIC VS NONPARAMETRIC TESTS: KEY DIFFERENCES
Parametric and nonparametric tests differ in their statistical foundation, the assumptions they make about the data, and the way they compare groups. Parametric tests usually estimate numerical parameters such as means, variances, regression coefficients, or distribution-specific model parameters. Nonparametric tests rely less on specific distributional forms and often use ranks, signs, or permutations to compare groups.
| Dimension | Parametric Tests | Nonparametric Tests |
|---|---|---|
| Main statistical basis | Estimate model parameters such as means, variances, regression coefficients, or distribution-specific parameters | Use ranks, signs, permutations, or distribution-free comparisons rather than relying directly on raw abundance values |
| Common methods | Student's t-test, Welch's t-test, paired t-test, ANOVA, linear models, negative binomial models | Mann–Whitney U test, Wilcoxon signed-rank test, Kruskal–Wallis test, Friedman test, permutation tests |
| Typical assumptions | Require assumptions about distribution, residual behavior, variance structure, independence, or model fit | Require fewer distributional assumptions, but still depend on correct independence, pairing, or blocking structure |
| Strengths | Often more powerful when assumptions are reasonable; can support covariates, batch effects, continuous predictors, and complex designs | More robust to skewed distributions, outliers, ordinal data, and rank-based comparisons |
| Limitations | Can be sensitive to assumption violations, outliers, inappropriate transformations, or poor model fit | May lose statistical power when parametric assumptions are met; may be less flexible for covariates or complex designs |
| Best-use scenarios | Well-normalized or transformed abundance data, designed experiments, covariate-adjusted comparisons, sequencing count models | Strongly skewed data, outlier-prone features, ordinal data, exploratory comparisons, or datasets poorly suited for parametric assumptions |
4. HOW TO CHOOSE STATISTICAL TESTS FOR OMICS DIFFERENTIAL ANALYSIS
The most reliable choice begins with the experimental design. Before selecting a statistical test, the analysis should first determine whether the samples are independent, paired, repeated, blocked, or influenced by covariates such as sex, age, batch, tissue region, time point, genotype, or treatment dose. Once the design structure is clear, data characteristics such as distribution, variance patterns, transformation strategy, and outliers should be evaluated. A normality test can be used as one diagnostic step to assess distributional assumptions, but it should not be treated as the only rule for choosing between parametric and nonparametric tests in omics data analysis.
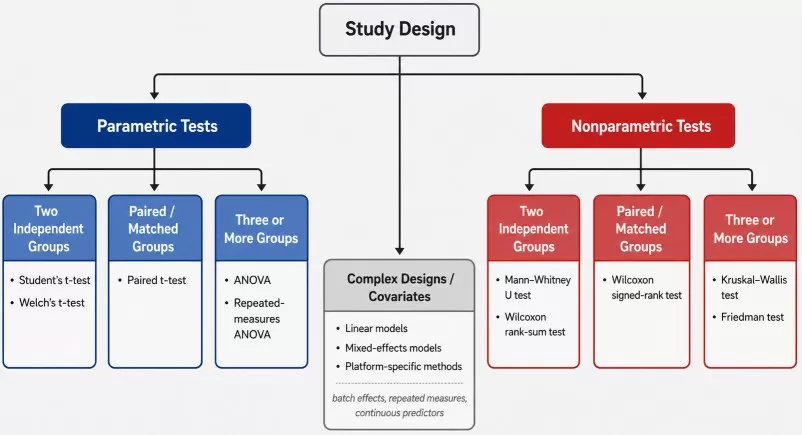
Statistical Test Selection Workflow for Omics Data Analysis
4.1 Two Independent Groups: t-Test, Welch's t-Test, or Mann–Whitney U Test
For two independent groups, the first question is whether the comparison involves two unrelated sample sets, such as treatment versus control, disease versus healthy, or two independent genotypes. Common parametric options include Student's t-test and Welch's t-test. Student's t-test is suitable when approximate normality and similar group variances are reasonable assumptions, while Welch's t-test is often preferred when group variances may differ. In many omics workflows, abundance values are normalized and log-transformed before a t-test or linear model is applied.
The Mann–Whitney U test, also known as the Wilcoxon rank-sum test, is a common nonparametric alternative for two independent groups. It may be useful when abundance values remain skewed, contain influential outliers, or are better interpreted through rank-based comparison than mean-based comparison. However, the result should not be described simply as a difference in means. It reflects evidence that values from one group tend to rank higher or lower than values from the other group, and differences in distribution shape or spread can also influence the result. (Learn more at: T-Test vs Welch's T-Test vs Mann–Whitney U)
4.2 Paired or Matched Groups: Paired t-Test or Wilcoxon Signed-Rank Test
For paired or matched designs, the statistical test must preserve the relationship between paired observations. Common examples include pre- and post-treatment samples from the same subject, matched tumor and adjacent normal tissues, paired left-right tissue sampling, or repeated sampling from the same animal. Treating these samples as independent can reduce statistical efficiency and may produce misleading p-values.
A paired t-test is appropriate when the within-pair differences are reasonably compatible with parametric assumptions. When within-pair differences are strongly non-normal, affected by outliers, or better suited to rank-based comparison, the Wilcoxon signed-rank test can be considered. The key point is that the test should evaluate the paired difference, not the two groups as unrelated sample sets.
4.3 Three or More Groups: ANOVA, Kruskal–Wallis, or Repeated-Measures Models
For three or more independent groups, analysis of variance (ANOVA) is the standard parametric method when assumptions about residual behavior, variance structure, and independence are reasonable. ANOVA tests whether there is evidence of a group effect across all groups, but a significant result does not identify which specific groups differ. Post hoc comparisons are still required for pairwise interpretation, and multiple testing correction should be considered when many features or comparisons are involved.
The Kruskal–Wallis test is a common nonparametric alternative for three or more independent groups. It is useful when rank-based comparison is more appropriate than parametric mean-based comparison. Similar to ANOVA, a significant Kruskal–Wallis result indicates that at least one group differs from the others, but follow-up post hoc testing is needed to locate the differences. For repeated-measures or blocked multi-group designs, repeated-measures ANOVA, linear mixed-effects models, or the Friedman test may be more appropriate depending on the study structure and assumptions. (Learn more at: ANOVA vs Welch ANOVA vs Kruskal-Wallis)
4.4 Covariates, Batch Effects, and Complex Omics Study Designs
Simple tests such as t-tests, Wilcoxon tests, ANOVA, and Kruskal–Wallis tests are often insufficient when an omics study includes covariates, batch effects, repeated measurements, blocking factors, or continuous predictors. Examples include age, sex, tissue region, injection order, sequencing batch, clinical score, treatment dose, time point, or subject-level repeated measures. In these cases, the statistical model should reflect the structure of the experiment rather than reducing the analysis to a simple group comparison.
Covariate-adjusted linear models, mixed-effects models, generalized models, or platform-specific differential analysis methods may be more appropriate for complex designs. This is especially important in metabolomics, proteomics, lipidomics, transcriptomics, and multi-omics studies where technical variation and biological heterogeneity can both affect feature-level statistics. When design factors are ignored, apparent group differences may reflect confounding effects rather than true biological signals.
5. INTERPRETING STATISTICAL TEST RESULTS IN OMICS DIFFERENTIAL ANALYSIS
Selecting the right statistical test is only one step in omics data interpretation. A significant p-value does not automatically indicate biological importance, and a large fold change does not always indicate statistical reliability. In metabolomics, lipidomics, proteomics, post-translational modification studies, and transcriptomics, differential features should be evaluated through both statistical evidence and biological context.
For this reason, differential feature selection should combine several layers of evidence:
- p-value or adjusted p-value to evaluate statistical evidence for group differences.
- Fold change or effect size to assess the magnitude and direction of molecular change.
- FDR correction to control the expected proportion of false discoveries when hundreds to thousands of molecular features are tested simultaneously (Benjamini & Hochberg, 1995).
- Quality control metrics to confirm that the signal is technically reliable and not driven by poor detection, missingness, or unstable measurement.
- Biological annotation to connect significant features with pathways, molecular functions, disease mechanisms, treatment responses, or phenotype-associated processes.
- Validation strategy to confirm key candidates using targeted assays, independent sample cohorts, orthogonal methods, or follow-up experiments.
Different evidence layers answer different questions: statistical testing evaluates group differences, fold change describes effect magnitude and direction, and FDR correction helps control false discoveries in high-throughput datasets. Biological annotation and pathway analysis then help determine whether differential features are meaningful in the context of metabolism, protein regulation, lipid remodeling, gene expression, or cellular phenotype. Platforms such as MetaboAnalyst 5.0 illustrate how statistical testing, functional interpretation, and pathway analysis can be connected in metabolomics workflows (Pang et al., 2021).
6. FAQs
Are t-tests and ANOVA parametric tests?
Yes. The t-test and ANOVA are parametric tests because they rely on assumptions about the data or model residuals, including approximate normality, variance behavior, and independence. In omics data analysis, these tests are often applied after appropriate normalization, transformation, and quality control.
Is the Wilcoxon test a nonparametric test?
Yes. The Wilcoxon rank-sum test and Wilcoxon signed-rank test are nonparametric tests. They are based on ranks rather than raw abundance values, making them useful when omics data are skewed, affected by outliers, or not well suited for mean-based parametric comparison.
When should a Mann–Whitney U test be used instead of a t-test?
A Mann–Whitney U test may be used instead of a t-test when comparing two independent groups and the data are strongly skewed, ordinal, or affected by outliers. In omics studies, it should be interpreted as a rank-based comparison of group distributions, not simply as a test of mean difference.
What is the nonparametric alternative to ANOVA?
The Kruskal–Wallis test is commonly used as a nonparametric alternative to one-way ANOVA for comparing three or more independent groups. For repeated-measures or blocked designs, the Friedman test may be considered instead. A significant result usually requires post hoc testing to identify which groups differ.
Do nonparametric tests require FDR correction in omics?
Yes. Nonparametric tests still generate p-values for many molecular features. In high-throughput omics data analysis, FDR correction is needed regardless of whether the original test is parametric, nonparametric, or model-based, because hundreds to thousands of features may be tested simultaneously.
Should omics data always use nonparametric tests?
No. Omics data should not automatically be analyzed with nonparametric tests. The appropriate method depends on preprocessing, distributional behavior, sample size, experimental design, variance structure, and the analysis objective. Normalized and log-transformed abundance data may be suitable for parametric tests or linear models, while strongly skewed or outlier-prone data may require nonparametric methods.
How do parametric and nonparametric tests affect biomarker discovery?
Parametric and nonparametric tests can both support biomarker discovery, but statistical testing alone is not sufficient. Candidate biomarkers should be evaluated using adjusted p-values, fold change or effect size, measurement reliability, biological relevance, and validation in targeted assays or independent cohorts.
How MetwareBio Supports Omics Statistical Analysis and Interpretation
High-quality omics services require more than molecular detection. Reliable interpretation depends on appropriate preprocessing, statistical test selection, multiple testing correction, biologically meaningful visualization, pathway analysis, and clear reporting. This is especially important for metabolomics, proteomics, lipidomics, transcriptomics, post-translational modification analysis, and multi-omics integration.
MetwareBio is a multi-omics CRO focused on mass spectrometry-based proteomics, metabolomics, lipidomics, and integrated multi-omics services. From project planning and sample preparation to data acquisition, statistical analysis, pathway interpretation, and report delivery, MetwareBio provides end-to-end support for omics research. This sample-to-insight workflow helps research teams better understand molecular changes, interpret biological mechanisms, and identify candidates for downstream validation.
Learn more about MetwareBio's multi-omics services and how our expert team can support your research from sample to insight.
Contact UsRead More: Statistical Methods for Omics Differential Analysis
From test selection through FDR correction and pathway interpretation, these articles cover the full statistical workflow for metabolomics, proteomics, and multi-omics differential analysis — helping you move from raw abundance data to biologically meaningful conclusions.
A detailed side-by-side comparison of three commonly used two-group tests in omics workflows. Understand when Welch's t-test outperforms Student's t-test due to unequal variances, and when the Mann–Whitney U test is the more appropriate rank-based alternative for skewed or outlier-prone abundance data.
When your study includes three or more groups, test selection becomes more nuanced. This article compares one-way ANOVA, Welch ANOVA, and Kruskal-Wallis, covering variance homogeneity assumptions, post hoc testing, and practical guidance for multi-group differential analysis in omics datasets.
Statistical significance alone is not sufficient for reliable biomarker selection. Learn how to combine p-values, fold change, VIP scores, and FDR correction to build a multi-criteria differential feature screening strategy that balances statistical rigor with biological relevance.
When testing thousands of molecular features simultaneously, uncorrected p-values inflate the false discovery rate substantially. This article explains the Benjamini–Hochberg procedure, q-values, and how to correctly apply and interpret FDR correction in metabolomics, proteomics, and transcriptomics workflows.
Proteomics datasets present unique statistical challenges including missing values, high dimensionality, and small sample sizes. This article covers practical test choices — from t-tests and limma-based linear models to empirical Bayes methods — tailored to DIA and DDA quantitative proteomics workflows.
After identifying differentially expressed features, correlation analysis helps reveal co-regulation patterns and molecular relationships. Learn how to choose between Pearson and Spearman correlation for omics data, interpret heatmap clustering, and avoid common pitfalls when communicating correlation results.
References
- Benjamini, Y., & Hochberg, Y. (1995). Controlling the false discovery rate: A practical and powerful approach to multiple testing. Journal of the Royal Statistical Society: Series B (Methodological), 57(1), 289–300. https://doi.org/10.1111/j.2517-6161.1995.tb02031.x
- Love, M. I., Huber, W., & Anders, S. (2014). Moderated estimation of fold change and dispersion for RNA-seq data with DESeq2. Genome Biology, 15, 550. https://doi.org/10.1186/s13059-014-0550-8
- Pang, Z., Chong, J., Zhou, G., de Lima Morais, D. A., Chang, L., Barrette, M., Gauthier, C., Jacques, P.-E., Li, S., & Xia, J. (2021). MetaboAnalyst 5.0: Narrowing the gap between raw spectra and functional insights. Nucleic Acids Research, 49(W1), W388–W396. https://doi.org/10.1093/nar/gkab382
- Ritchie, M. E., Phipson, B., Wu, D., Hu, Y., Law, C. W., Shi, W., & Smyth, G. K. (2015). limma powers differential expression analyses for RNA-sequencing and microarray studies. Nucleic Acids Research, 43(7), e47. https://doi.org/10.1093/nar/gkv007
- van den Berg, R. A., Hoefsloot, H. C. J., Westerhuis, J. A., Smilde, A. K., & van der Werf, M. J. (2006). Centering, scaling, and transformations: Improving the biological information content of metabolomics data. BMC Genomics, 7, 142. https://doi.org/10.1186/1471-2164-7-142
