Complex tissues contain cell types and states whose transcriptional programs may change independently during development, disease, or treatment. Bulk RNA sequencing can detect an overall difference but often cannot determine whether it reflects altered tissue composition or regulation within a particular population. Single-cell RNA sequencing (scRNA-seq) addresses this problem by resolving transcriptomes from individual cells or nuclei. Meaningful results nevertheless require coordinated decisions about sample preparation, molecular indexing, sequencing, and statistical analysis. This overview explains the principles, workflow, technology choices, and applications of single-cell transcriptomics, providing researchers with a practical foundation for understanding, designing, and interpreting scRNA-seq studies.
1. What Is Single-Cell RNA Sequencing (scRNA-seq)?
Single-cell RNA sequencing (scRNA-seq) is a transcriptomic approach that profiles gene expression at the level of individual cells. In a typical workflow, RNA molecules from each cell are captured, labeled with cell-specific barcodes, sequenced, and summarized in a gene-by-cell expression matrix. The resulting cell-resolved profiles enable identification of cell types and states and characterization of transcriptional heterogeneity within complex samples. Single-nucleus RNA sequencing (snRNA-seq) applies the same general principle to isolated nuclei and is particularly useful when intact cells are difficult to recover.
The defining difference between scRNA-seq and bulk RNA-seq is resolution. Bulk RNA-seq reports an average expression profile across all cells in a sample, while scRNA-seq retains the cellular origin of gene-expression signals. This cellular resolution allows researchers to distinguish shifts in cell composition from transcriptional changes within specific populations, identify rare or transitional cell states, and characterize cell-type-specific responses. scRNA-seq is therefore especially valuable for research focused on cellular composition, heterogeneity, cell identity, and cell-state-specific regulation.
Bulk RNA-seq vs. Single-Cell RNA-seq
| Feature | Bulk RNA-seq | Single-Cell RNA-seq (scRNA-seq) |
|---|---|---|
| Measurement unit | Whole tissue or pooled cell population | Individual cells |
| Expression profile | Average transcriptome across all cells | Cell-resolved transcriptomes |
| Cellular heterogeneity | Largely masked by signal averaging | Directly resolved |
| Cell-type composition | Usually requires indirect estimation or additional assays | Cell populations can be identified and quantified from the dataset |
| Cell-type-specific gene expression | Difficult to distinguish in mixed samples | Can be analyzed within defined cell populations |
| Rare or transitional populations | Signals may be diluted below detection at the population level | Can be identified when sufficiently represented and captured |
| Transcript coverage | Generally deeper and less sparse at the sample level | Shallower and more sparse for each individual cell |
| Primary research value | Population-level transcriptional changes | Cellular composition, heterogeneity, and cell-state-specific regulation |
| Best suited for | Questions focused on overall sample-level expression | Questions in which cell identity or cellular heterogeneity is biologically important |
2. How scRNA-seq Works: Core Molecular Principles
The core principle of single-cell RNA sequencing (scRNA-seq) is to preserve the cellular origin of RNA molecules while thousands of cells are processed and sequenced together. Once RNA from different cells is pooled, its source can no longer be distinguished directly. scRNA-seq therefore introduces cell-specific molecular identifiers before pooling, allowing sequencing reads to be traced back to individual cells. Most high-throughput workflows achieve this through three closely linked steps: single-cell partitioning, mRNA capture and barcoding, and UMI-based molecular counting. Together, these steps convert a mixed population of cells into thousands of individually identifiable transcriptomic profiles.
2.1 Single-Cell Partitioning and mRNA Capture
Single-cell partitioning creates a physical or molecular boundary around each cell so that its RNA can receive a unique identity. Depending on the platform, cells or nuclei may be separated into droplets, microwells, individual wells, or successive combinatorial-indexing reactions. In droplet-based scRNA-seq, for example, individual cells are co-encapsulated with barcoded beads carrying oligonucleotides for mRNA capture. Cell concentration must be carefully controlled because loading is probabilistic: excessive loading increases multiplets, while insufficient loading reduces cell recovery. Cell aggregates, debris, and poor suspension quality can further interfere with efficient partitioning.
After partitioning, cells are lysed and released mRNA is captured, commonly through hybridization between poly(dT) sequences on the capture oligonucleotide and the poly(A) tail of mRNA. During reverse transcription, captured transcripts are converted into cDNA while acquiring the barcode information associated with their partition. This is the critical step that links each transcript to its cell of origin. Once barcoding has occurred, cDNA from thousands of cells can be pooled for amplification, library preparation, and sequencing without losing cellular identity. The efficiency of this process depends on sample quality, RNA abundance, lysis efficiency, mRNA capture, and reverse-transcription chemistry, which partly explains why single-cell expression matrices are inherently sparse (Jovic et al., 2022).
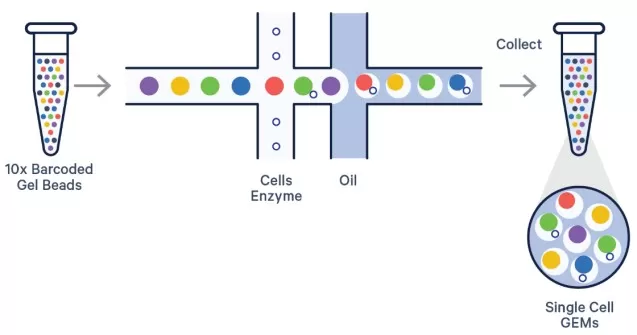
Single-cell partitioning and GEM generation in the 10x Genomics GEM-X workflow. Source: 10x Genomics. The neXt Generation of Single Cell RNA-seq: An Introduction to GEM-X Technology, Figure 1.
2.2 Cell Barcodes, UMIs, and Transcript Counting
Cell barcodes and unique molecular identifiers (UMIs) provide the coding framework for single-cell transcript quantification. A cell barcode identifies the cell or partition of origin, while a UMI tags each captured RNA molecule before amplification. Because one cDNA molecule can generate many sequencing reads, reads sharing the same gene, cell barcode, and UMI are collapsed into a single molecular count. This reduces amplification bias and improves the accuracy of transcript abundance estimates.
After sequencing, reads are assigned to cells, mapped to genes, and summarized into the gene-by-cell expression matrix used for downstream analysis. UMI counting improves quantification but cannot recover transcripts lost during capture or reverse transcription, contributing to the sparsity of scRNA-seq data. Additional sequencing can recover more molecules from an undersampled library, but gains diminish near library saturation. The final matrix therefore reflects both biological expression and molecular capture efficiency (Jovic et al., 2022).
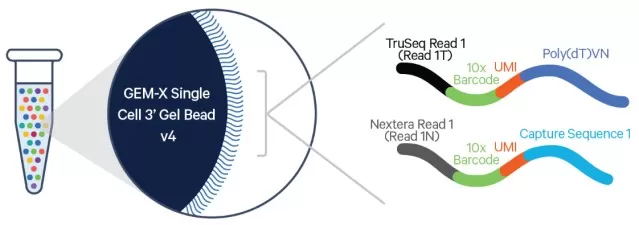
Oligonucleotide structure of a GEM-X Single Cell 3′ Gel Bead. Source: 10x Genomics. The neXt Generation of Single Cell RNA-seq: An Introduction to GEM-X Technology, Figure 2.
3. The Single-Cell RNA Sequencing Workflow
The single-cell RNA sequencing (scRNA-seq) workflow typically progresses from experimental design and sample preparation to cell or nucleus isolation, library construction, sequencing, and bioinformatics analysis. Through these stages, biological samples are converted into cell-resolved sequencing data and ultimately a gene-by-cell expression matrix for cell identification, comparison, and biological interpretation.
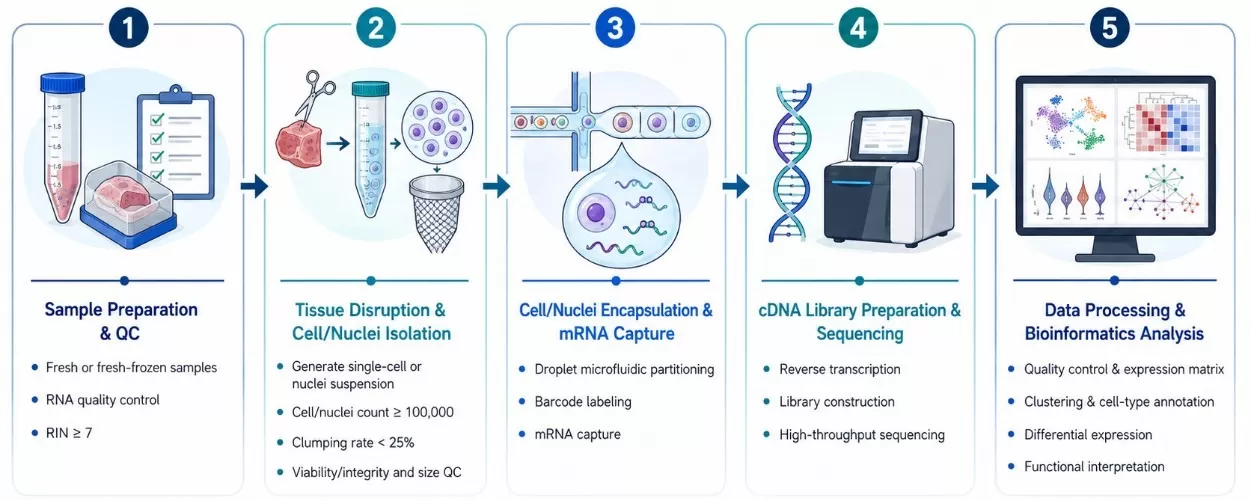
Experimental Workflow of Single-Cell RNA Sequencing
3.1 Experimental Design and Sample Planning
Study design starts by defining the biological endpoint. A project focused on cell composition, rare-population discovery, treatment response, or developmental progression may require very different numbers of biological replicates and cells. Increasing cell number improves the probability of sampling rare populations, while increasing independent donors or biological samples strengthens condition-level inference. These two forms of replication serve different purposes.
The experimental unit is usually the donor, organism, or independently treated sample. Cells derived from the same specimen share biological background and processing history, so they should not be treated as independent biological replicates in condition-level comparisons. Multi-sample studies should also distribute experimental groups across processing batches and sequencing runs to avoid confounding biological effects with technical variation (Zimmerman et al., 2021).
3.2 Tissue Dissociation and Cell/Nucleus Preparation
Sample preparation determines which cells ultimately enter the dataset. Fresh-tissue scRNA-seq requires a representative suspension with adequate viability, limited aggregation, and minimal debris. Dissociation conditions must be adapted to tissue structure because excessive digestion can damage cells or induce stress-related transcription, while insufficient dissociation can preferentially exclude embedded, adherent, or fragile populations. Ruptured cells can also release ambient RNA that contaminates surrounding droplets.
Single-nucleus RNA sequencing (snRNA-seq) provides an alternative for frozen, fibrous, fragile, or difficult-to-dissociate tissues. Nuclei isolation can reduce some dissociation-related biases, but nuclear RNA contains more unspliced transcripts and less mature cytoplasmic RNA. Whole-cell and nuclear workflows may therefore recover different transcript profiles and cell-type proportions, which should be considered when selecting the sample-preparation strategy and interpreting results (Oh et al., 2022; Wiegleb et al., 2022).
Whole-Cell scRNA-seq Versus Single-Nucleus RNA Sequencing
| Consideration | Whole-cell scRNA-seq | snRNA-seq |
|---|---|---|
| Analyzed material | Intact cells | Isolated nuclei |
| RNA profile | Nuclear and cytoplasmic RNA | Nuclear-enriched RNA with more pre-mRNA |
| Common sample fit | Fresh tissue or qualified cell suspension | Fresh, frozen, fragile, or difficult tissue |
| Main preparation risk | Dissociation stress, selective cell loss, reduced viability | Nuclear damage, debris, and loss of cytoplasmic information |
| Biological representation | Broader mature mRNA profile | Cell types may be recovered at different proportions |
| Selection priority | Representative viable cells can be obtained | Intact cells cannot be recovered reliably |
3.3 Library Preparation and Sequencing
Qualified cell or nucleus suspensions proceed through partitioning, RNA capture, reverse transcription, cDNA amplification, and library construction. Library quality control evaluates whether sufficient material with an appropriate fragment distribution has been generated, but it cannot correct biases already introduced during cell recovery or RNA capture.
Sequencing depth should be matched to cell number, RNA content, library complexity, and the intended analysis. Broad cell-type classification generally requires less information per cell than analyses of subtle transcriptional states or low-abundance genes. Additional sequencing can improve molecular recovery from an undersampled library, but it cannot compensate for poor sample quality, missing cell populations, or inadequate biological replication.
3.4 scRNA-seq Data Processing and Analysis
Primary scRNA-seq processing converts sequencing reads into a gene-by-cell expression matrix through barcode assignment, transcript mapping, and UMI counting. Quality control then evaluates features such as detected genes, total transcript counts, mitochondrial or organellar RNA, ambient RNA contamination, and potential doublets. Thresholds should be adapted to the tissue and cell types because expected RNA content and mitochondrial fractions can differ substantially across populations.
Downstream analysis typically includes normalization, dimensionality reduction, clustering, cell-type annotation, and comparison across samples or conditions. More advanced analyses—such as differential expression, differential abundance, trajectory inference, RNA velocity, cell–cell communication, and regulatory-network analysis—address different biological questions and rely on different assumptions. A robust analysis strategy therefore begins with the biological contrast to be tested and selects analytical methods accordingly, while preserving sample-level replication throughout statistical inference (Su et al., 2022).
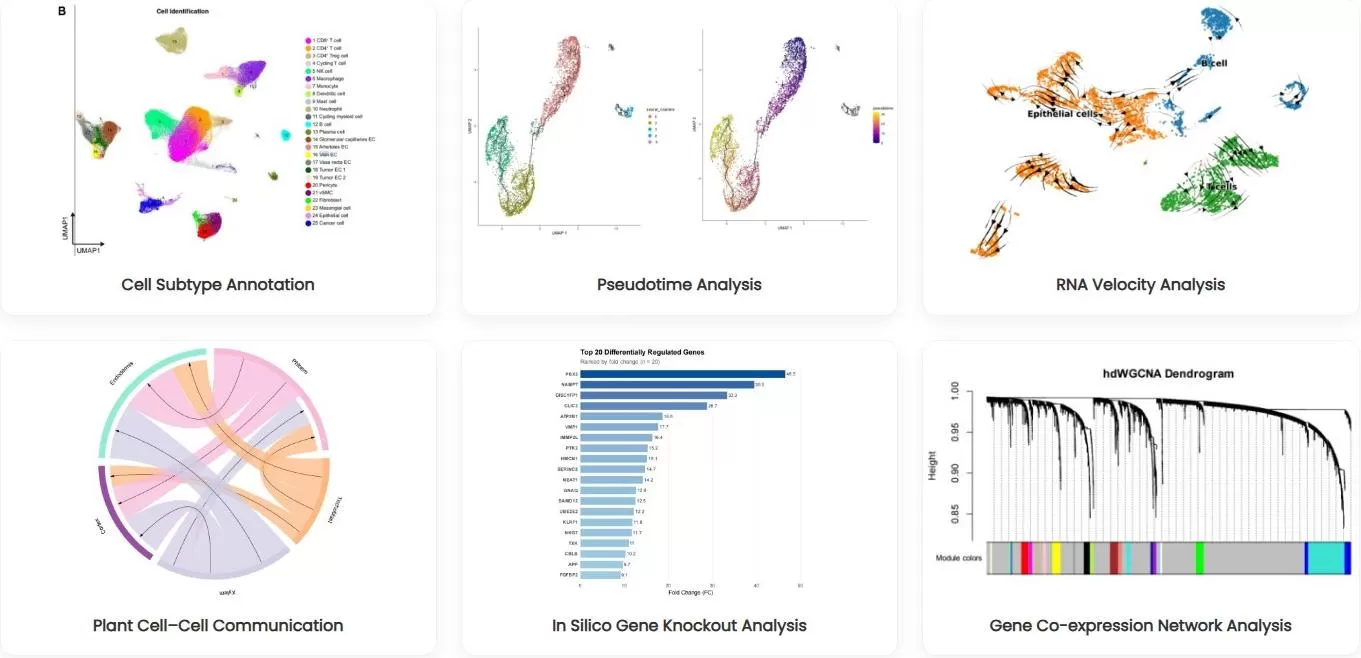
Representative downstream analyses of single-cell RNA sequencing data.
4. Major scRNA-seq Technologies
Single-cell RNA sequencing technologies differ mainly in two aspects: how much of each transcript is captured and how individual cells are separated and barcoded. These choices affect transcript-level information, cell throughput, sensitivity, sample compatibility, and ultimately which biological questions can be addressed efficiently. Understanding these two technology layers provides a practical basis for selecting an scRNA-seq strategy.
4.1 Transcript Coverage: Full-Length vs. 3′/5′ Profiling
Transcript-coverage strategy is determined during mRNA capture and library construction and defines how much sequence information is retained from each transcript. Full-length methods recover reads across a larger portion of the transcript and are therefore better suited to questions involving isoforms, alternative splicing, allele-specific expression, or sequence variants. Their lower throughput and greater per-cell sequencing requirement, however, make them less efficient for large-scale cell surveys.
By contrast, 3′- and 5′-end counting methods capture sequence near one end of each transcript and typically use UMIs for gene-level quantification. They sacrifice detailed transcript structure in exchange for higher throughput and efficient profiling of thousands to millions of cells. These approaches are therefore widely used for cell-type identification, cell-state analysis, and comparisons across biological conditions (Jovic et al., 2022).
Comparison of Transcript-Coverage Strategies
| Library strategy | Main information obtained | Principal advantage | Principal limitation | Typical research fit |
|---|---|---|---|---|
| Full-length | Broad transcript-body coverage | Better access to isoforms, splice junctions, and variants | Lower throughput and higher per-cell burden | Selected cells and transcript-structure questions |
| 3′ counting | Gene counts near transcript 3′ ends | Efficient UMI-based profiling of many cells | Limited isoform and 5′-region information | Cell atlases, heterogeneity, and group comparisons |
| 5′ counting | Gene counts near transcript 5′ ends | High-throughput UMI-based profiling from the 5′ end | Limited full-transcript information | Gene-expression studies requiring a 5′-compatible workflow |
4.2 Cell Partitioning and Indexing Strategies
Partitioning strategy operates at an earlier stage of the workflow and determines how individual cells acquire distinct identities before their RNA is pooled. Plate-based methods isolate one cell per addressable well and provide strong control over cell selection and traceability, making them useful when specific cells must be selected or linked to phenotypic information. Their main limitation is relatively low throughput.
Droplet and microwell platforms increase throughput by processing large numbers of cells in parallel with barcoded capture beads. Droplet systems are widely used for large-scale profiling but require well-prepared suspensions because cell concentration, aggregates, debris, and cell size can affect recovery and multiplet rates. Microwell systems offer another scalable physical-partitioning format, while combinatorial indexing identifies cells through successive rounds of barcoding and can achieve very high scalability without individually encapsulating every cell. Each strategy therefore represents a different balance among throughput, cell-selection control, sample compatibility, and workflow complexity.
Comparison of Single-Cell Partitioning Strategies
| Partitioning strategy | How cells are identified | Main strength | Important constraint |
|---|---|---|---|
| Plate-based | One sorted or selected cell per well | Direct cell selection and per-cell traceability | Lower throughput and more handling |
| Droplet-based | Cell and barcoded bead co-encapsulated in a droplet | High throughput and standardized gene counting | Sensitive to concentration, aggregation, debris, and cell size |
| Microwell-based | Cells settle into wells containing barcoded beads | Parallel capture with relatively simple physical arrays | Occupancy and capture uniformity require careful control |
| Combinatorial indexing | Successive rounds of barcodes create a unique combination | Scales without isolating every cell into a separate final compartment | More complex indexing design and method-specific coverage |
In practice, the best scRNA-seq platform is the one that matches the required transcript information, target cell number, sample condition, and biological endpoint. When sample behavior or cell recovery is uncertain, a pilot experiment can help evaluate suspension quality, cell-type representation, capture efficiency, and whether the chosen strategy provides sufficient information for the intended analysis.
5. Key Applications of Single-Cell RNA Sequencing
Single-cell RNA sequencing can provide cell-resolved information that is difficult to recover from bulk measurements, including cellular composition, cell-state diversity, developmental transitions, and population-specific responses to disease or treatment. Its value lies in linking transcriptional changes to defined cell populations, revealing which cells contribute to biological changes and how those responses differ across heterogeneous systems.
5.1 Mapping Cell Types, Cell States, and Rare Populations
Single-cell RNA sequencing is widely used to map cell types, cell states, and rare populations within complex tissues. By resolving expression profiles at the cellular level, it can reveal population structure masked in bulk measurements and provide reference maps for future studies. In the Tabula Sapiens project, researchers profiled nearly 500,000 cells from 24 human tissues and characterized more than 400 cell types. The study revealed tissue-specific expression and splicing patterns as well as cross-tissue features of immune-cell populations. This work demonstrated how large single-cell atlases can define cellular diversity and provide reference frameworks for annotating and interpreting new datasets (Tabula Sapiens Consortium, 2022).
5.2 Reconstructing Dynamic Biological Processes
Single-cell transcriptomics can resolve continuous processes such as differentiation, development, and environmental adaptation by capturing intermediate cell states that are difficult to distinguish at the tissue level. Han and colleagues used time-series scRNA-seq to investigate how light reshapes cell fate in Arabidopsis seedlings, profiling 92,861 cells across different light conditions. The data revealed progressive transcriptional changes in shoot populations and linked light exposure to guard-cell specialization and vascular development. By connecting temporal changes with cell-type-specific transcriptional responses, the study provided a cellular framework for understanding how environmental signals regulate plant development (Han et al., 2023).
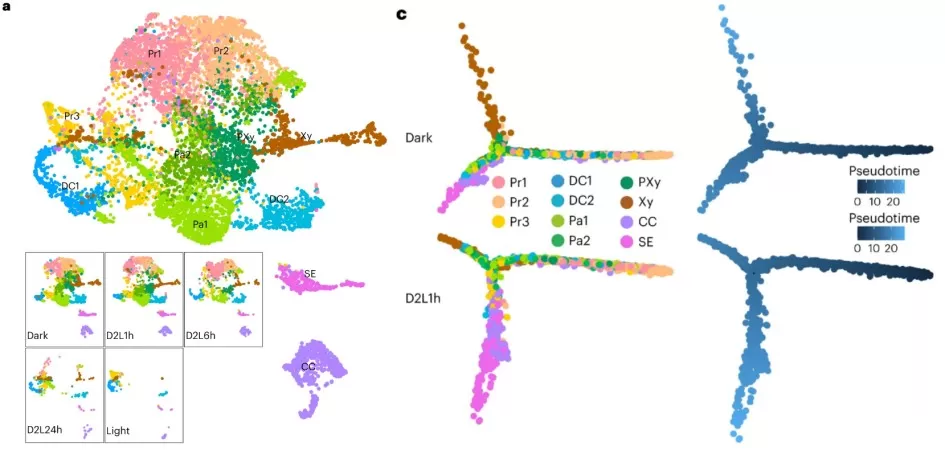
Light-driven changes in vascular cell differentiation during Arabidopsis de-etiolation. Single-cell transcriptomic analysis revealed dynamic vascular cell states across light exposure and developmental trajectories from procambial cells toward xylem and phloem lineages. Adapted from Han X, Zhang Y, Lou Z, et al. Nature Plants 9, 2095–2109 (2023), licensed under CC BY 4.0.
5.3 Characterizing Disease and Treatment Responses
In disease and treatment studies, scRNA-seq can distinguish changes in cell composition from transcriptional responses within specific malignant, immune, or stromal populations. Werba and colleagues analyzed 139,446 cells from pancreatic ductal adenocarcinoma samples collected before or after chemotherapy to examine treatment-associated changes in the tumor ecosystem. They identified distinct malignant and microenvironmental populations, characterized chemotherapy responses across malignant subtypes, and observed reduced inferred ligand–receptor interactions after treatment. TIGIT also emerged as a prominent inhibitory checkpoint in CD8-positive T cells. These findings illustrate how scRNA-seq can reveal cellular mechanisms of treatment response and identify candidate therapeutic targets for further investigation (Werba et al., 2023).
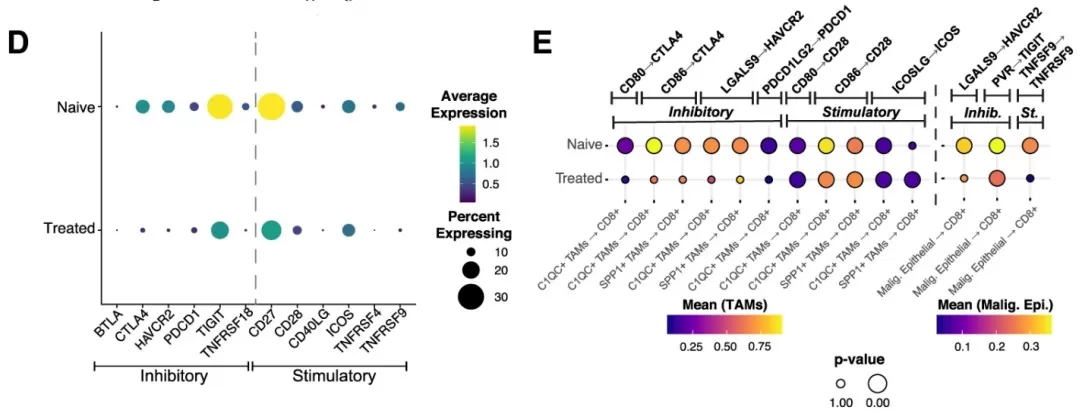
Single-cell analysis reveals chemotherapy-associated changes in immune checkpoint signaling in pancreatic cancer. scRNA-seq identified treatment-related changes in inhibitory checkpoint expression in CD8+ T cells and cell-type-specific checkpoint ligand–receptor interactions, highlighting the TIGIT–PVR axis in the PDAC tumor microenvironment. Adapted from Werba G, Weissinger D, Kawaler EA, et al. Nature Communications 14, 797 (2023), licensed under CC BY 4.0.
6. MetwareBio Single-Cell RNA Sequencing Services
MetwareBio provides end-to-end single-cell and single-nucleus RNA sequencing services, covering sample assessment and preparation, droplet-based partitioning, library construction, high-throughput sequencing, and bioinformatics analysis. Our workflows support biomedical, animal, and plant research and can be adapted to different sample types and study objectives. If you are planning an scRNA-seq or snRNA-seq project, please feel free to contact MetwareBio for more information or project consultation.
Contact UsRead More: Single-Cell RNA Sequencing and Downstream Data Analysis
These articles complement the current guide by covering single-cell technology fundamentals, co-expression and pathway enrichment analysis, multivariate statistics for omics data, multi-omics integration, and the broader bioinformatics workflows used to interpret cell-resolved datasets.
This article expands on the core principles covered in Sections 2 and 4, comparing single-cell isolation methods and full-length versus 3′/5′ profiling platforms, and walks through the standard scRNA-seq data analysis steps from raw processing to cell-type annotation.
Section 3.4 introduces the downstream analysis framework for single-cell data. This guide adds a complementary co-expression perspective, explaining gene module determination, module-trait association analysis, and the extraction of key candidate hub genes.
Section 5 highlights pathway-level interpretation of cell-type-resolved data. This article explains how to read KEGG enrichment metrics such as Gene Count and Rich Factor, and how to move from a list of enriched pathways to mechanistic conclusions.
Section 5 shows how scRNA-seq links transcriptional changes to defined cell populations. This article extends the discussion to integrating transcriptomics with proteomics, metabolomics, and microbiomics through name-, function-, and correlation-based strategies.
References
- Han, X., Zhang, Y., Lou, Z., Li, J., Wang, Z., Gao, C., Liu, Y., Ren, Z., Liu, W., Li, B., Pan, W., Zhang, H., Sang, Q., Wan, M., He, H., & Deng, X. W. (2023). Time series single-cell transcriptional atlases reveal cell fate differentiation driven by light in Arabidopsis seedlings. Nature Plants, 9, 2095–2109. https://doi.org/10.1038/s41477-023-01544-4
- Jovic, D., Liang, X., Zeng, H., Lin, L., Xu, F., & Luo, Y. (2022). Single-cell RNA sequencing technologies and applications: A brief overview. Clinical and Translational Medicine, 12(3), Article e694. https://doi.org/10.1002/ctm2.694
- Oh, J.-M., An, M., Son, D.-S., Choi, J., Cho, Y. B., Yoo, C. E., & Park, W.-Y. (2022). Comparison of cell type distribution between single-cell and single-nucleus RNA sequencing: Enrichment of adherent cell types in single-nucleus RNA sequencing. Experimental & Molecular Medicine, 54, 2128–2134. https://doi.org/10.1038/s12276-022-00892-z
- Su, M., Pan, T., Chen, Q.-Z., Zhou, W.-W., Gong, Y., Xu, G., Yan, H.-Y., Li, S., Shi, Q.-Z., Zhang, Y., He, X., Jiang, C.-J., Fan, S.-C., Li, X., Cairns, M. J., Wang, X., & Li, Y.-S. (2022). Data analysis guidelines for single-cell RNA-seq in biomedical studies and clinical applications. Military Medical Research, 9, Article 68. https://doi.org/10.1186/s40779-022-00434-8
- Tabula Sapiens Consortium. (2022). The Tabula Sapiens: A multiple-organ, single-cell transcriptomic atlas of humans. Science, 376(6594), Article eabl4896. https://doi.org/10.1126/science.abl4896
- Werba, G., Weissinger, D., Kawaler, E. A., Zhao, E., Kalfakakou, D., Dhara, S., Wang, L., Lim, H. B., Oh, G., Jing, X., Beri, N., Khanna, L., Gonda, T., Oberstein, P., Hajdu, C., Loomis, C., Heguy, A., Sherman, M. H., Lund, A. W., . . . Simeone, D. M. (2023). Single-cell RNA sequencing reveals the effects of chemotherapy on human pancreatic adenocarcinoma and its tumor microenvironment. Nature Communications, 14, Article 797. https://doi.org/10.1038/s41467-023-36296-4
- Wiegleb, G., Reinhardt, S., Dahl, A., & Posnien, N. (2022). Tissue dissociation for single-cell and single-nuclei RNA sequencing for low amounts of input material. Frontiers in Zoology, 19, Article 27. https://doi.org/10.1186/s12983-022-00472-x
- Zimmerman, K. D., Espeland, M. A., & Langefeld, C. D. (2021). A practical solution to pseudoreplication bias in single-cell studies. Nature Communications, 12, Article 738. https://doi.org/10.1038/s41467-021-21038-1