Large-cohort proteomics studies support candidate biomarker discovery, disease-risk modeling, molecular subtyping, treatment-response assessment, and integration with genetic or clinical data. Increasing the sample number, however, does not inherently improve study validity. Cohort scale also increases exposure to pre-analytical heterogeneity, batch effects, instrument drift, missing data, and multiple-testing burden. A valid study therefore requires coordinated planning of the research objective, cohort structure, biospecimen workflow, analytical platform, sample size, batch allocation, quality control (QC), statistical analysis, and validation. This article provides a practical framework for designing reproducible large-cohort proteomics studies, with specific guidance on biospecimen standardization, platform selection, statistical power, batch control, analytical QC, data analysis, and independent validation. It is intended to help researchers identify critical design decisions before project initiation, reduce avoidable technical bias, and generate proteomic data suitable for robust biological interpretation and downstream translation.
1. Define the Research Objective and Proteomics Study Design
Large-cohort proteomics studies should begin with a clearly defined research objective. Biomarker discovery, risk prediction, prognosis, molecular subtyping, mechanistic investigation, treatment-response assessment, and target prioritization require different cohort designs, endpoint definitions, statistical frameworks, and validation strategies. The table below summarizes these major research objectives, the questions they address, and the study designs and outputs most appropriate for each objective.
Table 1. Research Objectives and Study Designs for Large-Cohort Proteomics
| Research objective | Primary question | Appropriate design and principal output |
|---|---|---|
| Candidate biomarker discovery | Which proteins differ between clinically defined groups? | Case-control or cross-sectional study; adjusted effect estimates and prioritized candidates |
| Risk prediction | Do baseline protein measurements improve prediction of a future event? | Prospective cohort; discrimination, calibration, and incremental value beyond a reference model |
| Prognosis | Which proteins are associated with progression, recurrence, or survival? | Longitudinal or time-to-event study; adjusted hazard or trajectory estimates |
| Molecular subtyping | Are reproducible proteomic endotypes present within a heterogeneous disease? | Well-phenotyped cohort; stable clusters or latent factors with independent confirmation |
| Mechanistic investigation | Which protein-level processes are associated with a phenotype or intervention? | Cross-sectional, longitudinal, or experimental design; protein associations and pathway-level hypotheses |
| Treatment-response research | Which baseline or changing proteins are associated with benefit, toxicity, or resistance? | Paired longitudinal or interventional study; interaction or within-subject change estimates |
| Genetics and target prioritization | How are genetic variants associated with protein abundance, and can these associations inform target hypotheses? | Genotyped cohort; protein quantitative trait locus analysis and genetically informed follow-up |
Study design determines the conclusions that can be supported. A cross-sectional comparison can identify disease-associated proteins but cannot establish whether the protein change preceded disease onset. A prospective cohort provides temporal information, whereas a randomized intervention is more appropriate for estimating treatment effects. Prediction studies also require evaluation procedures that differ from association analyses. Large population studies demonstrate the use of plasma proteomics for genetic association analysis and disease-risk modeling (Sun et al., 2023; Carrasco-Zanini et al., 2024). The validity of these outputs depends on cohort structure, endpoint definition, experimental design, and validation strategy (Nakayasu et al., 2021).
Before calculating sample size, define the study population, protein variable or signature, primary endpoint, measurement time point, follow-up period, primary comparison, analysis population, and prespecified covariates. Together, these elements form a specific and testable primary objective, such as determining whether a baseline plasma protein signature predicts three-year disease recurrence after adjustment for relevant clinical factors. Secondary and exploratory analyses should be prespecified and clearly distinguished from the primary analysis before data examination.
2. Standardize Biospecimen Collection and Pre-Analytical Variables
Biospecimen selection should reflect biological relevance, accessibility, analytical feasibility, and the intended conclusion. Plasma and serum are suitable for many population and biomarker studies but present a wide protein concentration range. Tissue can provide a more direct representation of local pathology, although sampling location, cellular composition, ischemic time, and pathological heterogeneity require control. Urine, cerebrospinal fluid, milk, and other biofluids require matrix-specific collection, processing, and normalization strategies. For blood-based cohorts, the choice between serum and plasma should be made before recruitment and applied consistently.
Pre-analytical variables may introduce systematic variation before instrumental analysis. In blood studies, relevant variables include anticoagulant type, collection tube, processing delay, centrifugation protocol, clotting conditions, hemolysis, aliquot volume, storage temperature, storage duration, and freeze-thaw history. In tissue studies, collection method, warm and cold ischemia, anatomical region, preservation method, and cellular composition require documentation. Multi-center studies should use harmonized SOPs and prospectively document collection, processing, storage, and protocol deviations that could affect protein measurements (Nakayasu et al., 2021).
Table 2. Essential Biospecimen Metadata for Large-Cohort Proteomics
| Metadata domain | Required examples | Analytical purpose |
|---|---|---|
| Participant and phenotype | Age, sex, body mass index, diagnostic criteria, disease stage, treatment, comorbidities | Defines the analysis population and supports covariate adjustment |
| Collection | Center, date and time, fasting status, collection device, anticoagulant, processing delay | Identifies systematic pre-analytical differences |
| Processing and storage | Centrifugation, aliquoting, preservation, storage duration and temperature, freeze-thaw count | Helps distinguish biology from handling effects |
| Specimen quality | Hemolysis, lipemia, visible contamination, tissue pathology, cellularity | Supports exclusion criteria and sensitivity analyses |
| Laboratory workflow | Plate, preparation batch, operator, reagent lot, instrument, column, run order | Enables technical monitoring and batch-aware analysis |
Biological groups should have comparable collection and storage histories. If cases and controls originate from different centers, collection protocols, or storage periods, the biological comparison may be confounded with sample handling. Metadata distributions and cross-tabulations should therefore be reviewed before laboratory allocation. When complete harmonization is not possible, exclusions, covariate adjustments, and sensitivity analyses should be prespecified. If a critical pre-analytical factor is fully confounded with the primary biological comparison, additional sampling or redesign may be required. Statistical correction cannot independently estimate two variables that do not vary separately.
3. Select the Proteomics Platform and Quantification Strategy
Platform selection should be based on the research objective, biospecimen, target scope, required throughput, sample volume, and validation plan. In mass spectrometry (MS), data-dependent acquisition (DDA) and data-independent acquisition (DIA) define how precursor ions are selected for analysis, whereas label-free quantification and isobaric labeling, including tandem mass tags (TMT), define how protein abundance is quantified. A complete MS workflow should therefore specify both the acquisition and quantification strategies. Different strategies have distinct requirements for analytical depth, throughput, missing-data control, batch comparability, quality control, and downstream validation. A detailed comparison of the two principal acquisition strategies is provided in DIA Proteomics vs DDA Proteomics. The table below summarizes the relevance and principal design considerations of commonly used proteomics strategies for large-cohort studies.
Table 3. Proteomics Strategies for Large-Cohort Studies
| Analytical strategy | Relevance to cohort research | Principal design considerations |
|---|---|---|
| DIA-MS, commonly label-free | Discovery-oriented measurement with systematic acquisition across samples | Requires stable chromatography, longitudinal MS monitoring, planned QC placement, and a cross-batch data strategy |
| DDA-MS, label-free or labeled | Flexible discovery, fractionation, and spectral-library generation | Stochastic precursor selection may increase missingness in some workflows; performance depends on acquisition and data-processing settings |
| TMT or other isobaric labeling | Multiplexes samples within sets and can reduce within-set acquisition variation | Requires balanced plex design and a common reference strategy; ratio compression and between-plex comparability must be considered |
| Affinity-based platforms | High-throughput measurement of predefined targets, including selected low-abundance proteins | Restricted to assay-defined targets; binding specificity, panel composition, and the subsequent validation route require evaluation |
DIA-MS is particularly well suited to large-cohort proteomics because its systematic acquisition strategy provides broad proteome coverage, high quantitative reproducibility, and fewer missing values across samples than conventional discovery workflows. These advantages support reliable protein quantification across hundreds or thousands of samples, making label-free DIA-MS a recommended strategy for large-scale biomarker discovery, molecular profiling, and clinical cohort research. Targeted or affinity-based panels are more suitable when the candidate proteins are predefined, whereas sample fractionation can increase proteome depth for mechanism-focused studies but reduces throughput. Platform selection should ultimately reflect whether the study prioritizes broad protein discovery, predefined target measurement, or maximum analytical depth. See Affinity-Based and MS-Based Proteomics Platforms for a detailed comparison.
4. Determine Sample Size, Statistical Power, and Pilot Requirements
Sample size should be calculated for the primary analysis rather than selected from precedent or defined only by the available number of samples. The calculation must reflect the study population, primary endpoint, statistical model, expected effect size, biological and technical variance, group ratio, and planned control of multiple testing. Proteome-wide discovery studies must account for the large number of correlated protein measurements, whereas survival studies depend primarily on the number of outcome events. Longitudinal studies must incorporate repeated-measure timing, within-participant correlation, and attrition, while prediction studies require sufficient outcome events for model development and validation.
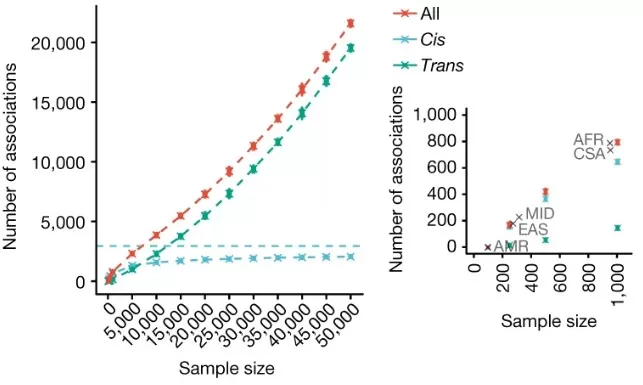
Figure 1. Cohort Size and pQTL Discovery in Population-Scale Proteomics. The number of primary protein quantitative trait locus associations identified across different subsampled cohort sizes in the UK Biobank Pharma Proteomics Project. Adapted from Sun et al. (2023) under the CC BY 4.0 license.
Eligibility and exclusion criteria must be defined before sample-size calculation. Clinical inclusion and exclusion criteria establish the target population based on factors such as diagnosis, disease stage, age, treatment status, and availability of the required biospecimen and metadata. Analytical exclusion criteria address insufficient sample volume, severe hemolysis, contamination, excessive freeze–thaw exposure, protocol deviations, or failure to meet predefined QC requirements. These criteria should be applied consistently and without reference to the observed protein–phenotype associations.
The calculated sample size represents the number of analyzable samples required for the primary analysis, not simply the number collected or submitted. The enrollment or submission target should therefore account for expected sample loss. For example, if 400 analyzable samples are required and approximately 10% are expected to fail eligibility or analytical QC, at least 445 samples should be collected or submitted. Additional adjustment may be required for unequal group sizes, low event rates, participant dropout, or incomplete follow-up.
Variance, missingness, and exclusion-rate assumptions should be obtained from comparable datasets or a matrix- and platform-specific pilot study. The pilot should use representative biospecimens and reproduce the planned preparation method, plate design, randomization, acquisition workflow, QC placement, and data-processing pipeline. It should quantify sample-processing success, consistently measured proteins, feature-level variability, missingness, run-order drift, and the effects of relevant pre-analytical variables. These results should be used to update the power calculation, determine the final sample-submission target, and establish acceptance criteria for the full cohort.
5. Control Batch Effects Through Randomization, Blocking, and Quality Control
Large-cohort proteomics projects commonly span multiple preparation plates, reagent lots, analytical sequences, and instrument-maintenance periods. Preparation date, operator, plate position, column condition, sensitivity drift, and run order can influence measured protein abundance. Experimental design must therefore prevent these technical factors from becoming confounded with the biological variables of interest. Additional QC principles are described in Proteomics Quality Control: A Practical Guide.
Randomize and Balance Cohort Samples Across Batches
Samples should be randomized across preparation plates, batches, and run order while maintaining essential design constraints. Disease status, collection center, sex, age category, treatment arm, and time point should be distributed across batches as evenly as feasible. In longitudinal studies, allocation of repeated samples should reflect the primary within-participant comparison.
Block randomization reduces the probability of severe imbalance. Samples may be randomized within strata defined by disease group and collection center, while matched pairs may be assigned together. Laboratory staff should remain blinded where feasible, and identifiers should not encode biological group.
Each biologically relevant group must be represented across the technical conditions included in the analysis. If all cases are processed on one plate and all controls on another, plate and disease status are fully confounded. No statistical model can independently estimate both effects from that design, and batch correction may either retain technical variation or remove biological signal (Čuklina et al., 2021; Burger et al., 2021).
Establish a Multi-Layer Proteomics Quality-Control System
No single QC material can monitor every stage of a cohort-scale workflow. Complementary controls are required to distinguish instrument instability, sample-preparation variation, batch drift, carryover, and sample-specific failure. QC frequency and acceptance limits should be qualified for the study matrix, analytical platform, method duration, and intended use (Tsantilas et al., 2024).
Table 4. Quality Control Components for Large-Cohort Proteomics
| QC component | Primary variable monitored | Application in large-cohort proteomics |
|---|---|---|
| System-suitability or instrument QC | LC-MS sensitivity, retention behavior, mass accuracy, peak shape, identification performance | Confirms analytical readiness and monitors longitudinal system stability |
| Process QC | Digestion, cleanup, transfer, and other preparation steps | Reveals sample-preparation failures or plate-specific variation |
| Pooled cohort QC | Repeatability in a matrix representative of the study | Tracks preparation consistency, signal drift, and batch comparability across the run order |
| Long-term reference or bridge sample | Comparability across plates, reagent lots, instruments, or extended acquisition periods | Provides a repeated reference for cross-batch monitoring and, when justified, normalization |
| Blank | Carryover and background contamination | Detects contamination and carryover at predefined positions in the sequence |
| Internal standards | Digestion, retention time, recovery, or instrument response, depending on the material | Monitors the process steps occurring after the standard is introduced |
A pooled cohort QC represents the average study matrix but cannot identify participant-specific defects or uncommon sample subtypes. A commercial reference may support longitudinal monitoring but differ from the study matrix, while internal standards assess only the stages following their addition. The purpose, preparation, placement, acceptance criteria, and interpretation of each control should be documented prospectively.
Predefine Run Order, Acceptance Criteria, and Corrective Actions
The acquisition plan should define QC and blank placement, plate interleaving, instrument assignment, and documentation of maintenance or column replacement. Monitoring frequency should detect drift over the timescale relevant to study samples; one fixed interval is not applicable to all matrices and acquisition methods.
Acceptance criteria should be derived from method qualification, pilot data, historical performance, or fit-for-purpose reference data. Metrics may include retention-time stability, mass accuracy, signal intensity, identifications, missingness, carryover, replicate correlation, and feature-level coefficients of variation. A single median coefficient of variation can conceal unstable features and temporal drift.
Corrective actions should be defined before acquisition and may include pausing the sequence, cleaning or recalibration, QC or sample reinjection, and repeat preparation. Interventions and affected samples should be recorded in an auditable change log. Large-scale DIA studies have shown that instrument condition and acquisition time can influence quantitative measurements, supporting longitudinal QC monitoring (Poulos et al., 2020).
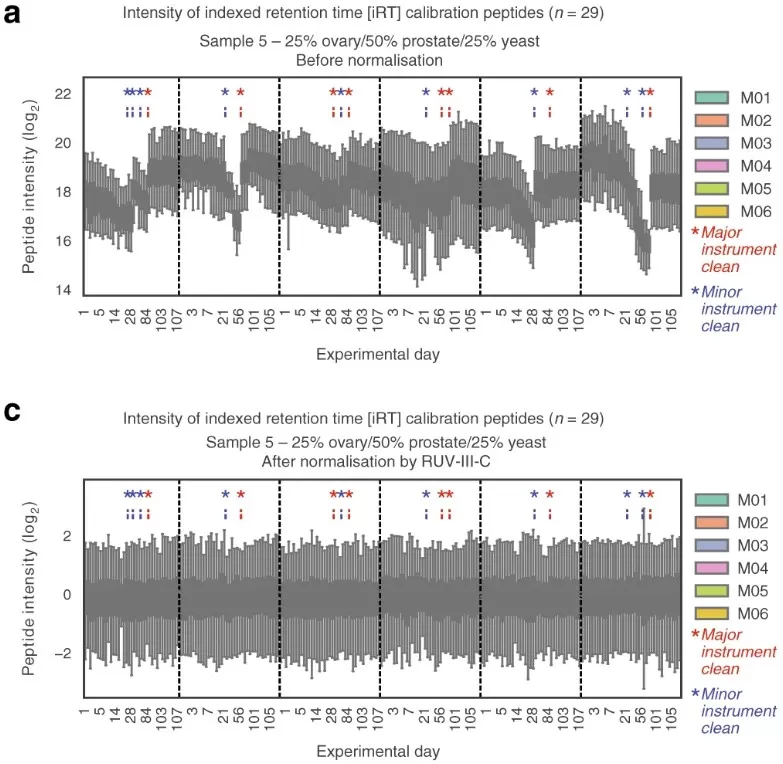
Figure 2. Longitudinal Signal Drift in Large-Scale DIA Proteomics. Longitudinal variation in peptide signal across instruments before and after normalization, illustrating the importance of continuous performance monitoring in large-scale DIA proteomics. Adapted from Poulos et al. (2020) under the CC BY 4.0 license.
The batch map should link every sample to collection variables, plate and well position, operator, reagent lot, instrument, column, injection time, run order, adjacent QC measurements, maintenance, and protocol deviations. Statistical analysis cannot recover biological information that was not preserved by the experimental design.
6. Predefine Proteomics Data Processing, Statistical Analysis, and Validation
The statistical analysis plan should be finalized before examination of outcome-related patterns. It should define sample- and protein-level QC, normalization, missing-data handling, batch assessment, covariate adjustment, multiplicity control, primary contrasts, sensitivity analyses, and validation.
Assess Data Quality Before Biological Comparison
Before testing biological differences or clinical associations, data quality should be evaluated at the analytical-system, sample, and protein levels using predefined acceptance criteria. System performance should be assessed from QC and reference samples by examining retention-time stability, signal intensity, identification and quantification counts, carryover, and run-order drift. At the sample level, protein counts, total signal, missingness, correlation with pooled QC samples, and multivariate outlier patterns should be reviewed to identify preparation or acquisition failures. At the protein level, detection frequency, QC coefficient of variation, missingness pattern, and dependence on batch or run order should determine whether a feature is retained for analysis.
Sample failures must be distinguished from proteins that are inconsistently quantified across the cohort. Missing-value filtering or imputation should reflect whether missingness results from low abundance, analytical failure, or random variation. Normalization and batch-effect correction should be selected according to observed QC behavior and verified by comparing data distributions, QC consistency, technical variance, and biological signal before and after correction. When phenotype and batch are confounded, statistical correction cannot reliably separate the two effects and may remove true biological variation (Čuklina et al., 2021).
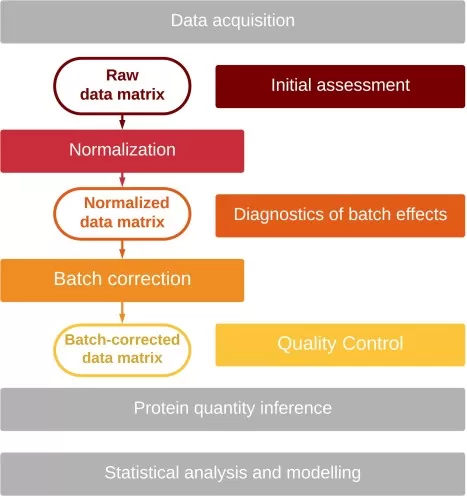
Figure 3. Batch-Effect Assessment and Correction Workflow for Large-Scale Proteomics. A five-stage workflow for assessing, normalizing, diagnosing, correcting, and validating batch effects in large-scale proteomics data. Adapted from Čuklina et al. (2021) under the CC BY 4.0 license.
Match the Statistical Model to the Primary Endpoint
- Use regression or moderated linear models for continuous protein abundance and cross-sectional contrasts, with prespecified adjustment for relevant biological and technical covariates.
- Use logistic models for binary outcomes when the scientific target is association; use prediction-specific workflows when the target is classification.
- Use Cox or another appropriate time-to-event model for incident outcomes, with assessment of model assumptions.
- Use mixed-effects models or generalized estimating equations for repeated measurements, accounting for within-participant correlation.
- Test treatment-response hypotheses through appropriate time, treatment, and interaction terms rather than separate within-group significance tests.
Proteome-wide inference requires multiplicity control and reporting of effect estimates with uncertainty rather than p-values alone. Pathway enrichment and network analysis can organize candidate proteins, but enrichment does not establish pathway activation, directionality, or causality. Separation in a heatmap or principal component analysis is descriptive and does not demonstrate generalizable classification performance.
Separate Model Development From Independent Validation
Prediction studies require strict separation of model development and performance evaluation. When data-dependent, normalization, filtering, imputation, feature selection, and hyperparameter tuning must be conducted within the training or resampling framework to prevent information leakage. Internal validation may use bootstrap or nested cross-validation. Performance reporting should include uncertainty, discrimination, and calibration. External validation evaluates transportability and cannot be replaced by internal resampling.
Validation should proceed through distinct stages:
- Analytical verification: Establish that prioritized proteins can be measured with adequate selectivity, precision, and sensitivity using a fit-for-purpose assay, such as PRM or MRM. Where appropriate, confirm key findings with an orthogonal method, such as an immunoassay.
- Biological replication: Evaluate effect direction and magnitude in independent samples collected under a defined protocol.
- Model validation: Test the locked model in an independent population representative of the intended application.
- Clinical validation and utility: Determine whether the marker or model performs for its intended clinical purpose and improves decision-making. Discovery proteomics alone does not establish clinical utility.
Before completion of the relevant validation stages, the appropriate terms are "candidate biomarker" and "protein signature," rather than "validated clinical biomarker." Reproducibility also requires preservation of SOPs, analysis code, software versions, sample-to-batch maps, and QC reports. When consent and data-governance requirements permit, raw and processed MS data should be deposited in a ProteomeXchange partner repository such as PRIDE, with reporting aligned to established proteomics information standards (Taylor et al., 2007; Deutsch et al., 2020).
7. Plan Your Large-Cohort Proteomics Study with MetwareBio
Successful large-cohort proteomics depends on alignment between the research objective, cohort structure, analytical workflow, QC plan, and statistical model. Sample number contributes statistical power, but interpretability depends on whether biological comparisons remain estimable and measurements remain comparable across the complete cohort.
MetwareBio combines high-throughput DIA mass spectrometry with experience in large-cohort proteomics projects spanning diverse biospecimens and cohort sizes. Standardized experimental workflows, structured batch allocation, fit-for-purpose QC, and bioinformatics support are integrated to generate analysis-ready proteomic datasets and support biological interpretation. For researchers planning large-cohort plasma or serum proteomics studies, MetwareBio is currently offering DIA-based plasma proteomics starting from $299/sample for eligible large-cohort projects.
Read More: Large-Cohort Proteomics Study Design and Validation
These articles complement the current guide by covering platform selection, biospecimen considerations, biomarker discovery workflows, targeted validation, and multi-omics integration for large-scale proteomics research.
Compare the two principal MS acquisition strategies discussed in Section 3. This article covers spectral library generation, missingness control, quantification accuracy, and throughput considerations that directly influence cohort-scale platform selection.
Section 2 emphasizes that the serum-versus-plasma choice must be made before recruitment. This article examines protein composition differences, anticoagulant effects, and analytical implications for population-scale blood proteomics studies.
Connect the study-design framework to its most common objective. This article walks through differential analysis, multiple-testing correction, effect-size estimation, and candidate prioritization for biomarker discovery cohorts.
Section 6 recommends PRM or MRM for analytical verification of candidate proteins. This guide compares the two targeted acquisition modes in terms of selectivity, sensitivity, throughput, and suitability for validation assays.
Explore the recommended platform for large-cohort proteomics in greater depth. This service page details the DIA-MS workflow, instrumentation, data-processing pipeline, and QC system that support reproducible protein quantification across thousands of samples.
Large-cohort proteomics often integrates with genomics and clinical data. This article covers multi-omics study design, data integration strategies, and how proteomic signatures complement genetic and metabolomic information for disease-risk modeling.
References
- Sun BB, Chiou J, Traylor M, et al. Plasma proteomic associations with genetics and health in the UK Biobank. Nature. 2023;622:329-338. https://doi.org/10.1038/s41586-023-06592-6
- Carrasco-Zanini J, Pietzner M, Davitte J, et al. Proteomic signatures improve risk prediction for common and rare diseases. Nature Medicine. 2024;30:2489-2498. https://doi.org/10.1038/s41591-024-03142-z
- Nakayasu ES, Gritsenko M, Piehowski PD, et al. Tutorial: best practices and considerations for mass-spectrometry-based protein biomarker discovery and validation. Nature Protocols. 2021;16:3737-3760. https://doi.org/10.1038/s41596-021-00566-6
- Čuklina J, Lee CH, Williams EG, et al. Diagnostics and correction of batch effects in large-scale proteomic studies: a tutorial. Molecular Systems Biology. 2021;17:e10240. https://doi.org/10.15252/msb.202110240
- Burger B, Vaudel M, Barsnes H. Importance of block randomization when designing proteomics experiments. Journal of Proteome Research. 2021;20:122-128. https://doi.org/10.1021/acs.jproteome.0c00536
- Tsantilas KA, Merrihew GE, Robbins JE, et al. A framework for quality control in quantitative proteomics. Journal of Proteome Research. 2024;23:4392-4408. https://doi.org/10.1021/acs.jproteome.4c00363
- Poulos RC, Hains PG, Shah R, et al. Strategies to enable large-scale proteomics for reproducible research. Nature Communications. 2020;11:3793. https://doi.org/10.1038/s41467-020-17641-3
- Taylor CF, Paton NW, Lilley KS, et al. The minimum information about a proteomics experiment (MIAPE). Nature Biotechnology. 2007;25:887-893. https://doi.org/10.1038/nbt1329
- Deutsch EW, Bandeira N, Sharma V, et al. The ProteomeXchange consortium in 2020: enabling "big data" approaches in proteomics. Nucleic Acids Research. 2020;48:D1145-D1152. https://doi.org/10.1093/nar/gkz984