A metabolomics data matrix and a lipidomics data matrix can look strikingly similar: samples in rows, molecular features in columns, and abundance values across the matrix. Both can be processed within a broadly similar QC and statistical framework, but the two diverge when features must be assigned molecular identities and interpreted at different structural levels. A label such as PC 34:1, for example, may describe a sum composition rather than one uniquely resolved phosphatidylcholine molecule. This article compares the shared data-analysis backbone of metabolomics and lipidomics, with particular attention to structural annotation, isomer ambiguity, nomenclature, and lipid-specific interpretation. It also links these analytical differences to study design, showing when broad metabolomics, dedicated lipidomics, or a combined strategy is appropriate and how MetwareBio's corresponding services can support those research goals.
1. Lipidomics vs Metabolomics: Different Chemical Scope and Structural Focus
The two fields overlap analytically, but they organize chemical information differently. In this comparison, metabolomics refers primarily to broad LC-MS-based metabolic profiling rather than narrowly targeted assays.
1.1 Metabolomics: Broad Chemical Coverage and Pathway-Level Interpretation
Metabolomics surveys chemically diverse small molecules across many pathways, including amino acids, organic acids, nucleotides, carbohydrates, cofactors, hormones, and a subset of lipid-related compounds. Broad LC-MS metabolomics therefore prioritizes chemical-space coverage and the discovery of metabolic patterns that may not be known in advance. Analytical output often begins as features defined by mass-to-charge ratio, retention time, and signal intensity, followed by annotation or identification using accurate mass, MS/MS spectra, retention behavior, reference libraries, and authentic standards when available (Alseekh et al., 2021).
Because metabolite identities can be supported by different levels of evidence, broad metabolomics should not be interpreted as a complete catalog of all small molecules in a sample. Typical downstream questions include which metabolites differ between conditions, which pathways are perturbed, and how those changes relate to phenotype. MetwareBio's separate guide to metabolite identification in LC-MS metabolomics discusses identification confidence in more detail.
1.2 Lipidomics: A Lipid-Centered and Structure-Aware Analytical Space
Lipidomics narrows the chemical space to lipids while adding a more explicit structural hierarchy. A lipid annotation can describe category, class, and backbone first, then fatty-acyl composition and unsaturation, and only add sn-position, double-bond position, or stereochemistry when the data support those assignments. That hierarchy matters because the same abundance change can be interpreted at several levels: as an individual lipid species, a class-level shift, or a broader change in chain-length or unsaturation distribution.
Broad metabolomics can still capture a subset of lipid-related signals. Dedicated lipidomics is built around lipid chemistry, with extraction, separation, acquisition, annotation, and downstream interpretation optimized accordingly. This makes lipid structural composition a primary analytical dimension rather than a secondary one (Köfeler et al., 2021).
2. Shared Analytical Frameworks in Metabolomics and Lipidomics
Once a reliable quantitative feature matrix has been generated, the statistical backbone of the two workflows is largely shared. The same analytical method, however, can serve different purposes depending on where it is used in the workflow.
2.1 Quality Control, Preprocessing, and Technical Normalization
Both datasets require feature and sample filtering, missing-value assessment, normalization, and checks for analytical variation. Pooled QC samples monitor reproducibility across an analytical batch; CV distributions, correlations among pooled QC injections, and PCA can flag unstable features, outlying injections, drift, or batch structure. The principle is shared, but the implementation is not identical. In lipidomics, large differences in analytical response among lipid classes make the choice of internal standards and normalization strategy especially important; class-matched or class-aware approaches may be preferable to a single global correction when the assay supports them (Mosley et al., 2024; Köfeler et al., 2021).
Missing values deserve separate attention because a zero or absent peak does not always mean biological absence. Low abundance, ion suppression, peak-picking failure, or retention-time instability can all remove a feature from part of the matrix. In lipidomics, these effects may be uneven across lipid classes because ionization efficiency and chromatographic behavior differ strongly among neutral lipids, phospholipids, and sphingolipids. Imputation should therefore follow the likely source of missingness rather than being applied as a routine software step. Normalization should likewise be judged against QC behavior and study design, not by whether it makes experimental groups look more separated (Mosley et al., 2024; Köfeler et al., 2021).
At the QC stage, PCA and correlation are primarily diagnostic tools. They help identify analytical inconsistency, outliers, or technical structure; biological group separation is interpreted only after data quality has been established.
2.2 Statistical Analysis and Biological Pattern Discovery
After QC, the common statistical tasks fall into a few distinct categories. PCA provides an unsupervised view of the dominant sources of sample variation, while univariate testing combined with fold change and multiple-testing correction is used to prioritize features that differ between groups. Clustering and correlation help identify groups of features that vary together. Supervised models such as OPLS-DA can be useful for classification, but they require appropriate validation to guard against overfitting; ROC analysis is relevant when a defined classification question or candidate marker set is being evaluated, rather than as a default step in every omics workflow.
Because the statistical toolkit is so similar, lipidomics can appear to be metabolomics with a different feature list. The real divergence begins when features are assigned molecular identities and summarized at structural levels that matter biologically.
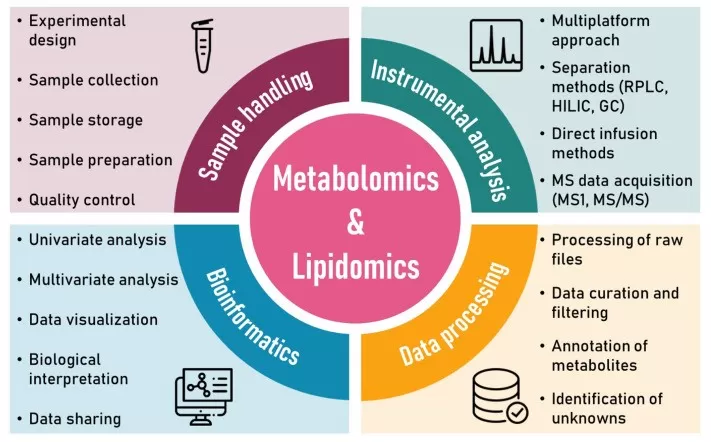
Figure 1. Shared workflow components in metabolomics and lipidomics, covering sample handling, instrumental analysis, data processing, and bioinformatics. Image reproduced from Figure 1 in Rakusanova and Cajka (2024), Physiological Research, licensed under the journal's Creative Commons Attribution (CC BY) license.
3. Lipidomics Data Analysis Challenges: Identification, Isomers, and Nomenclature
A detected lipid feature should not automatically be treated as a fully resolved molecular structure. Lipid shorthand nomenclature is designed to encode how much structural information the experimental evidence actually supports (Liebisch et al., 2020).
3.1 Hierarchical Levels of Lipid Identification
Consider a phosphatidylcholine annotation. PC 34:1 reports the lipid class together with total carbon and double-bond counts, but it does not specify the fatty-acyl pairing. PC 16:0_18:1 adds chain composition while leaving sn-position unresolved, whereas PC 16:0/18:1 indicates positional assignment of the two chains. Even that notation does not specify the location of the C=C bond or whether double-bond geometry has been determined. Moving from sum composition to molecular species, sn-specific structure, double-bond position, and a fully defined structure therefore represents increasing experimental evidence rather than alternative spellings of the same certainty level (Liebisch et al., 2020).
In practice, the reported lipid name should stop at the level supported by the measurement. Assigning a sum-composition feature to a specific molecular structure can propagate error into database mapping, literature comparison, and mechanistic interpretation. The same evidence-to-annotation principle applies across lipid classes; Figure 2 illustrates the hierarchy using glucosylceramide as an example.
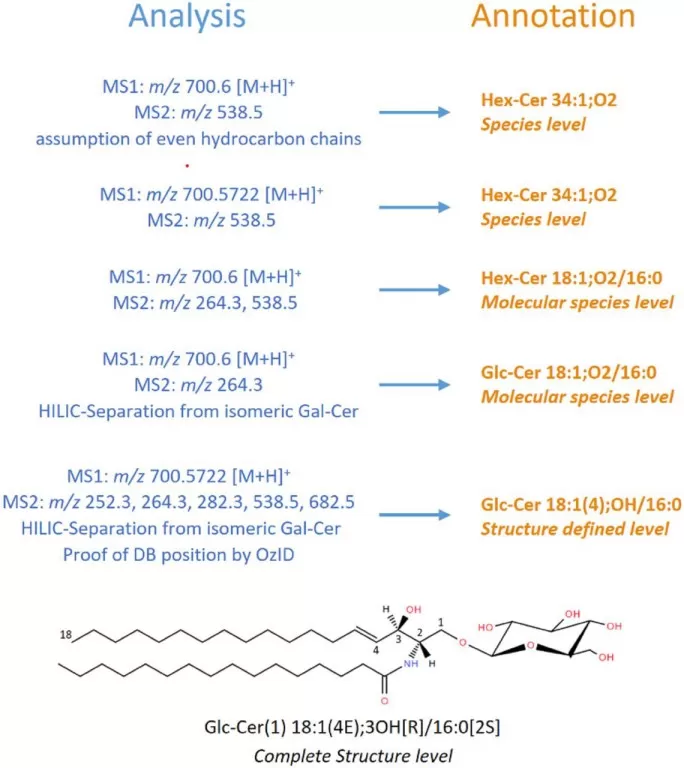
Figure 2. Hierarchical lipid annotation illustrated using glucosylceramide, showing how increasing analytical evidence supports progressively more detailed structural assignments. Image reproduced from Figure 1 in Liebisch et al. (2020), Journal of Lipid Research, licensed under the Creative Commons Attribution 4.0 International License (CC BY 4.0).
3.2 Lipid Isomers, Isobars, and Feature Ambiguity
Lipids can differ by fatty-acyl combination, sn-position, double-bond position, cis/trans geometry, or linkage chemistry while sharing the same or very similar precursor masses. Isobaric species, adducts, in-source fragments, and duplicated features add another layer of ambiguity. Consequently, matching m/z alone is insufficient, and even conventional MS/MS may resolve only part of the structural hierarchy.
Higher structural resolution requires methods that address the specific ambiguity in question. Chromatographic or ion-mobility separation can distinguish selected isomers before or during mass analysis, whereas derivatization and specialized fragmentation can generate diagnostic information about double-bond or chain position. These approaches solve different structural problems, so a method that resolves one isomer type should not be assumed to resolve all others. Reviews of deep lipidotyping emphasize that C=C locations and sn-positions require method-specific evidence beyond ordinary species-level annotation (Zhang et al., 2022).
The practical consequence is easy to miss when a dataset contains only one name per row. A molecular-species annotation such as PC 16:0_18:1 can establish the two acyl chains without resolving their sn-positions, and an unresolved chromatographic peak may still contain more than one structural isomer. If those isomers change in different directions, the aggregate signal can mask the underlying remodeling; if the feature is reported at an unjustifiably specific level, downstream pathway or enzyme hypotheses may become equally specific without adequate evidence. Structural-resolution requirements are therefore best defined before biological interpretation, especially when a study aims to connect a lipid change to a particular enzyme, oxidation product, or signaling mechanism (Liebisch et al., 2020; Zhang et al., 2022).
3.3 Lipid Nomenclature and Data Harmonization
Lipid naming is not merely a formatting issue. Different software packages, databases, laboratories, and publications may use different shorthand systems or report lipids at different structural levels. The underscore in PC 16:0_18:1 and the slash in PC 16:0/18:1, for example, encode different positional evidence. If those distinctions are removed during data cleaning, different levels of structural certainty can be collapsed into a single label.
Standardized nomenclature therefore matters for database mapping, enrichment analysis, network construction, cross-study comparison, and multi-omics integration. LIPID MAPS shorthand notation provides a community framework in which reported names track structural resolution, while grammar-based tools such as Goslin can translate common lipid naming dialects into a standardized representation (Liebisch et al., 2020; Kopczynski et al., 2020). Informatics reviews likewise identify nomenclature harmonization and fit-for-purpose tool selection as core components of lipidomics analysis rather than optional cleanup steps (Ni et al., 2023).
4. Lipid-Specific Data Analysis: From Differential Lipids to Structural Remodeling
A lipidomics report that ends with differential-lipid lists and generic pathway enrichment uses only part of the information encoded by lipid structure. Lipid-specific interpretation becomes more informative when individual species are reorganized by class, chain composition, unsaturation, or reaction context.
4.1 Lipid Class and Subclass Composition
Class-level summaries group related species into broader lipid classes: for example, TG and DG within glycerolipids, PC and PE within glycerophospholipids, and SM or Cer within sphingolipids. This makes it possible to distinguish a broad shift in a lipid pool from a change driven by one or two individual species. A coordinated increase in storage lipids, for example, answers a different biological question from a single strongly changing TG species.
Class summaries require careful interpretation. Summed signal intensities depend on analytical coverage, ionization behavior, and the quantification strategy. Unless the method provides a valid basis for absolute cross-class comparison, a larger summed signal for one lipid class should not be interpreted as proof that its true molar pool is larger than that of another class (Köfeler et al., 2021).
4.2 Chain Length and Unsaturation as Lipid Remodeling Features
Lipidomics can also reorganize data by total chain length, saturation state, and class-specific structural indices. Summarizing lipids by chain length or degree of unsaturation can reveal broader remodeling trends that are difficult to see from individual species alone. Average Chain Length (ACL) and Average Degree of Unsaturation (ADU), when calculated within an appropriate lipid class, are examples of abundance-weighted summaries used for this type of comparison.
ACL and ADU are structural summaries, not direct readouts of enzyme activity or membrane biophysics. They are most useful for highlighting trends that can then be tested against pathway, enzyme, or phenotype hypotheses. A calculation-focused explanation is available in MetwareBio's guide to Average Chain Length and Average Degree of Unsaturation in lipidomics.
Class totals and chain-level summaries answer complementary questions. For example, total PC abundance could remain almost unchanged while shorter or more saturated PC species decrease and longer or more unsaturated species increase. A class-level result would describe a stable phosphatidylcholine pool, whereas chain-length and unsaturation summaries would reveal substantial internal remodeling. Such patterns can motivate hypotheses involving fatty-acid elongation, desaturation, membrane composition, or oxidative susceptibility, but they still require supporting biochemical or functional evidence. Reading class abundance together with species-level and structural summaries is therefore more informative than treating any one of these views as a complete description of the lipidome.
4.3 Lipid Structure in Pathway and Network Interpretation
Lipid-specific interpretation can operate at several levels. Structural-feature enrichment asks whether changes cluster within a lipid class, chain-length range, or unsaturation pattern. Reaction-oriented networks connect lipids through known biochemical transformations, while lipid ratios or class transitions can prioritize candidate remodeling steps. LORA illustrates the first approach; LINEX² maps quantitative changes onto lipid reaction networks and analyzes network and moiety patterns (Vondrackova et al., 2023; Rose et al., 2023).
These approaches complement conventional pathway analysis by retaining structural details that generic pathway labels often lose, including chain length, double-bond number, linkage type, and acyl composition. They can prioritize candidate enzymes or remodeling processes, but they do not measure reaction flux, enzyme activity, or causality.
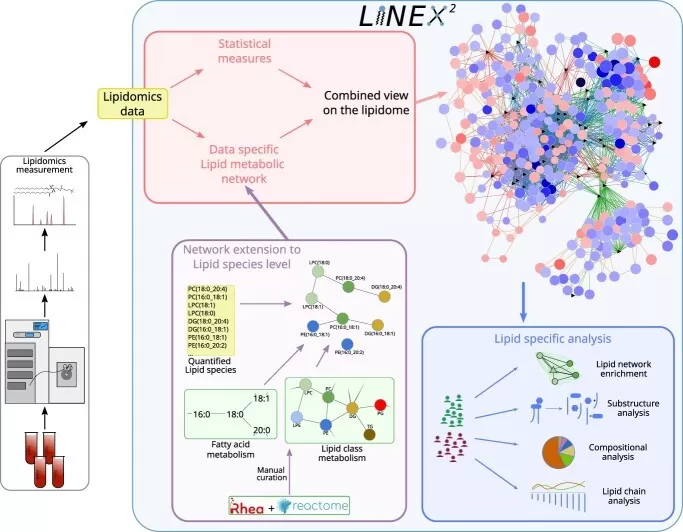
Figure 3. LINEX² workflow for network- and structure-aware analysis of lipidomics data. Lipid measurements are integrated with statistical information and data-specific lipid metabolic networks to support network enrichment, substructure, compositional, and lipid-chain analyses. Image reproduced from Figure 1 in Rose et al. (2023), Briefings in Bioinformatics, licensed under the Creative Commons Attribution 4.0 International License (CC BY 4.0).
Table 1. Lipidomics vs Metabolomics Data Analysis: Key Differences in Annotation and Interpretation
| Dimension | Metabolomics | Lipidomics |
|---|---|---|
| Main chemical space | Broad small-molecule classes across many pathways | Lipid-focused space organized by category, class, and structural features |
| Shared QC and statistics | QC, normalization, PCA, differential analysis, clustering, correlation | Largely the same statistical toolkit, with lipid-aware platform and normalization considerations |
| Molecular annotation | Metabolite annotation/identification with variable confidence | Hierarchical lipid annotation in which the reported name should match structural evidence |
| Major ambiguity | Isomers, adducts/in-source fragments, multiple candidate annotations, and unidentified features | Extensive isomeric/isobaric ambiguity, adduct or fragment interference, and multiple structural-resolution levels |
| Naming | Compound names and identifiers; harmonization remains important | Shorthand notation is tied to structural resolution, including fatty-acyl and positional information where applicable |
| Common downstream analysis | Differential metabolites, clustering/correlation, pathway interpretation | Differential lipids plus class, chain-length, unsaturation, and lipid-aware pathway/network analysis |
| Structure-aware analysis | Typically secondary in broad metabolomics | A central interpretation layer involving class, chain length, unsaturation, linkage, and acyl composition |
| Main interpretation risk | Overstating metabolite identity or pathway significance | Overstating structural resolution or mechanism from lipid patterns |
5. Lipidomics vs Metabolomics for Different Research Questions
A practical choice depends on the biological level at which the conclusion must be made: broad pathway context, lipid remodeling, or a specific lipid structure.
Scenario A: Broad metabolic discovery. Broad or untargeted metabolomics is the better starting point when the important metabolites are not known in advance and the goal is to map changes across several chemical classes. Its main advantage is breadth: it can reveal metabolic changes outside the lipid-focused chemical space, including pathways that a lipid-only assay may not capture.
Scenario B: Lipid remodeling and composition. Dedicated lipidomics is more appropriate when membrane composition, storage lipids, sphingolipids, or ferroptosis-related lipids are themselves part of the biological endpoint. In these studies, class balance, acyl-chain composition, and unsaturation are not secondary annotations; they are part of what the study is trying to explain. Such questions arise in cardiometabolic disease, cancer, neurobiology, and plant stress research.
Scenario C: Combined metabolic and lipid context. A combined metabolomics-lipidomics design is useful when a study needs system-wide metabolic context as well as a deeper view of lipid composition. The two measurements are not redundant: metabolomics broadens chemical coverage, whereas lipidomics adds lipid-specific structural annotation and remodeling information.
Scenario D: Higher lipid structural resolution. If the conclusion depends on a specific double-bond position, sn-isomer, or fully defined lipid structure, the structural capabilities of the analytical platform should be confirmed before study initiation. Routine lipidomics should not be assumed to resolve every isomer; specialized structural lipidomics methods may be required (Zhang et al., 2022).
Platform choice should also reflect the stage of the study. Broad metabolomics is especially useful in discovery work, where important non-lipid metabolites or pathways may not yet be known. Quantitative lipidomics becomes more valuable when the biological question already centers on lipid classes, remodeling patterns, or reproducible comparison of a defined lipid space. A combined design is most informative when lipid and non-lipid metabolism are both part of the hypothesis and the same or well-matched samples can be interpreted together. Running both platforms without a clear cross-omics question may add cost and multiple-testing burden without adding proportional biological insight.
These distinctions also provide a practical basis for choosing between MetwareBio's untargeted metabolomics and quantitative lipidomics workflows, or for using both when broad metabolic context and lipid-specific remodeling are equally important.
6. MetwareBio Lipidomics and Metabolomics Services by Study Goal
For lipid-focused projects, MetwareBio's quantitative lipidomics workflows use MTBE-based lipid extraction, C30 chromatographic separation, proprietary lipid databases, class-specific internal standards, and MRM acquisition to support reproducible semi-quantitative profiling. Downstream analysis can include lipid composition, chain-length and unsaturation analysis, differential lipid screening, clustering, and pathway interpretation. The standard quantitative workflow does not fully resolve all lipid isomers; positional isomers, including sn-position and double-bond positional isomers, may require specialized targeted method development or additional structural characterization. Projects that depend on this level of identity should define the required structural evidence before sample submission.
For broader discovery questions, MetwareBio's high-resolution LC-MS/MS untargeted metabolomics service supports broad metabolite profiling, annotation, QC, statistical comparison, differential-metabolite screening, and pathway analysis. When both global metabolic change and detailed lipid remodeling are central to the hypothesis, a combined metabolomics-lipidomics design can provide complementary evidence rather than forcing one platform to answer both questions.
Planning a metabolomics or lipidomics study but unsure how much chemical coverage or structural resolution is needed? Contact MetwareBio to discuss the sample type, quantitative goals, and biological question, and to identify a metabolomics, lipidomics, or combined strategy that fits the study.
Contact UsRead More: Lipidomics and Metabolomics Data Analysis
These articles extend the comparison by covering multivariate statistics, lipid nomenclature and informatics tools, untargeted metabolomics workflows, and the statistical assumptions behind QC and differential analysis in omics datasets.
Section 2.2 positions PCA as unsupervised exploration and supervised models as classification tools. This guide details when to use each method and how to validate supervised models against overfitting.
Section 2.1 notes that PCA is primarily diagnostic at the QC stage. This article explains how to read PCA score plots, identify outliers, and assess replicate consistency before supervised analysis.
Section 3.3 highlights why standardized nomenclature matters for database mapping. This guide reviews LIPID MAPS, SwissLipids, and key software tools that support lipid identification and harmonized annotation.
Section 1.2 describes the structural hierarchy of lipid annotation. This article builds that foundation by explaining lipid classes, backbone structures, and the analytical techniques used to characterize them.
Section 5 describes when broad metabolomics is the right starting point. This guide walks through the complete untargeted workflow, from experimental design and data acquisition to statistical analysis and metabolite identification.
Section 2.2 notes that univariate testing relies on statistical assumptions. This article covers graphical and formal normality tests that underpin valid t-tests and ANOVA in metabolomics and lipidomics datasets.
References
- Alseekh, S., Aharoni, A., Brotman, Y., et al. (2021). Mass spectrometry-based metabolomics: a guide for annotation, quantification and best reporting practices. Nature Methods, 18(7), 747-756. https://doi.org/10.1038/s41592-021-01197-1
- Kopczynski, D., Hoffmann, N., Peng, B., & Ahrends, R. (2020). Goslin: a grammar of succinct lipid nomenclature. Analytical Chemistry, 92(16), 10957-10960. https://doi.org/10.1021/acs.analchem.0c01690
- Köfeler, H. C., Ahrends, R., Baker, E. S., et al. (2021). Recommendations for good practice in MS-based lipidomics. Journal of Lipid Research, 62, 100138. https://doi.org/10.1016/j.jlr.2021.100138
- Liebisch, G., Fahy, E., Aoki, J., et al. (2020). Update on LIPID MAPS classification, nomenclature, and shorthand notation for MS-derived lipid structures. Journal of Lipid Research, 61(12), 1539-1555. https://doi.org/10.1194/jlr.S120001025
- Mosley, J. D., Schock, T. B., Beecher, C. W., et al. (2024). Establishing a framework for best practices for quality assurance and quality control in untargeted metabolomics. Metabolomics, 20, 20. https://doi.org/10.1007/s11306-023-02080-0
- Ni, Z., Wölk, M., Jukes, G., et al. (2023). Guiding the choice of informatics software and tools for lipidomics research applications. Nature Methods, 20(2), 193-204. https://doi.org/10.1038/s41592-022-01710-0
- Rakusanova, S., & Cajka, T. (2024). Metabolomics and lipidomics for studying metabolic syndrome: insights into cardiovascular diseases, type 1 & 2 diabetes, and metabolic dysfunction-associated steatotic liver disease. Physiological Research, 73(Suppl. 1), S165-S183. https://doi.org/10.33549/physiolres.935443
- Rose, T. D., Köhler, N., Falk, L., Klischat, L., Lazareva, O. E., & Pauling, J. K. (2023). Lipid network and moiety analysis for revealing enzymatic dysregulation and mechanistic alterations from lipidomics data. Briefings in Bioinformatics, 24(1), bbac572. https://doi.org/10.1093/bib/bbac572
- Vondrackova, M., Kopczynski, D., Hoffmann, N., & Kuda, O. (2023). LORA, lipid over-representation analysis based on structural information. Analytical Chemistry, 95(34), 12600-12604. https://doi.org/10.1021/acs.analchem.3c02039
- Zhang, W., Jian, R., Zhao, J., Liu, Y., & Xia, Y. (2022). Deep-lipidotyping by mass spectrometry: recent technical advances and applications. Journal of Lipid Research, 63(7), 100219. https://doi.org/10.1016/j.jlr.2022.100219