Lipidomics profiles lipids at the class and molecular-species levels to characterize lipid composition and metabolic changes in biological systems. Because lipid measurements are highly influenced by experimental and analytical conditions, reliable results depend on a well-designed and consistently executed workflow. A typical lipidomics workflow includes strategy selection, sample handling, lipid extraction, chromatographic separation, LC-MS/MS acquisition, data processing, lipid identification and quantification, statistical analysis, and biological interpretation. Decisions made at each stage can affect downstream data quality and ultimately the conclusions drawn from the study. This guide explains the purpose, key considerations, and analytical logic of each step in the lipidomics workflow. It is designed to help researchers understand how the workflow fits together, make informed methodological choices for their research questions, and generate lipidomics data that are more reproducible, interpretable, and useful for addressing biological hypotheses.
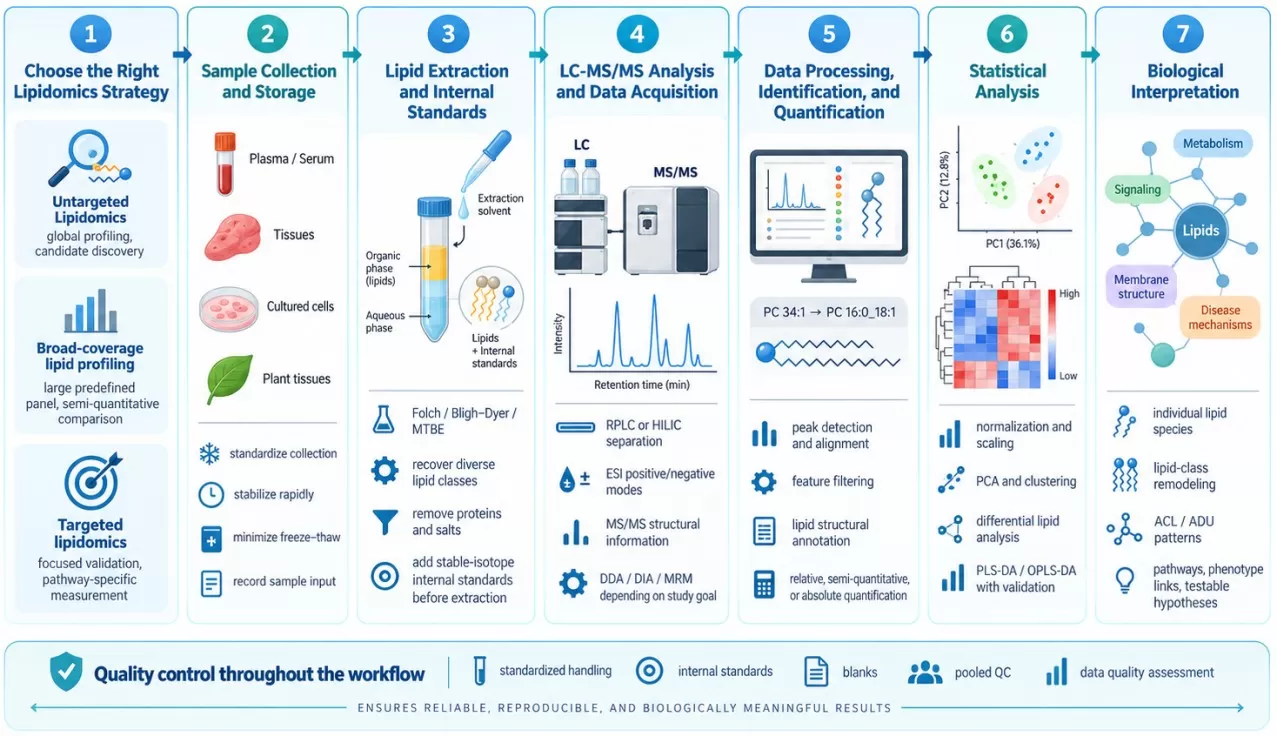
LC-MS/MS Lipidomics Workflow from Strategy Selection to Biological Interpretation
Step 1: Choose the Right Lipidomics Strategy
The first decision in a lipidomics workflow is to define what kind of lipid information the study needs. Lipidomics strategies differ mainly in the breadth of lipid coverage, whether the analytes are predefined, and the level of quantitative confidence required.
- Untargeted lipidomics is primarily used for exploratory studies in which the relevant lipid changes are not yet known. It surveys a broad range of detectable lipid features, making it suitable for global lipid profiling, candidate discovery, and hypothesis generation.
- Broad-coverage lipid profiling measures a large predefined set of lipid species across multiple lipid classes, providing broad lipidome coverage together with consistent cross-sample comparison. A common form is MetwareBio’s quantitative lipidomics, which uses internal standards to support semi-quantitative measurement of large lipid panels and is particularly useful for phenotype comparisons, treatment-response studies, and large cohorts. For a more detailed introduction, see our guide to quantitative lipidomics.
- Targeted lipidomics focuses on a predefined set of biologically relevant lipids. It is best suited to focused research questions such as candidate validation, pathway-specific investigation, or concentration measurement when appropriate standards and calibration are available.
Table 1. Comparison of Lipidomics Strategies for Different Research Goals
| Lipidomics strategy | Main research goal | Typical scope | Typical quantitative output | Best suited for |
|---|---|---|---|---|
| Untargeted lipidomics | Discover unexpected lipid changes and generate hypotheses | Broad survey of detectable lipid features | Primarily relative abundance | Discovery studies, exploratory phenotype comparisons, candidate lipid screening |
| Broad-coverage lipid profiling | Characterize broad lipid changes with consistent cross-sample measurement | Large predefined lipid set spanning multiple classes | Relative or semi-quantitative abundance | Group comparisons, treatment response, cohort studies, lipid-class and structural remodeling |
| Targeted lipidomics | Measure predefined lipids with high analytical focus | Small to moderate predefined panel | Relative, semi-quantitative, or absolute quantification depending on assay design | Candidate validation, pathway-focused studies, candidat biomarker verification, precise concentration measurement |
The most appropriate strategy therefore depends on what the study needs to learn. Researchers seeking new lipid candidates generally benefit from broader discovery coverage, while studies with a defined biological hypothesis can prioritize targeted measurement and quantitative precision. Broad-coverage profiling is particularly useful when the goal is to characterize lipidome-wide changes across many samples without relying on an unrestricted feature-discovery workflow.
Step 2: Sample Collection and Storage for Lipidomics
Sample collection is the first point at which the biological lipid profile can be altered by the experimental procedure itself. Once a sample is removed from its original environment, endogenous enzymes, oxidation, hydrolysis, temperature changes, and processing delays can continue to modify lipid composition until the material is stabilized (Züllig et al., 2020; Köfeler et al., 2021). For lipidomics, the practical goal is therefore to minimize these pre-analytical changes and apply the same handling procedure to all samples being compared, so that the measured differences are more likely to reflect the biological condition of interest.
The appropriate collection procedure depends on the sample matrix:
- For plasma and serum, use the same collection tubes or anticoagulants throughout the study, standardize the interval between collection and plasma/serum separation, minimize hemolysis, and freeze aliquots promptly to reduce repeated freeze-thaw cycles.
- For tissues, collect comparable anatomical regions, minimize the time between dissection and stabilization, and rapidly freeze samples while keeping tissue mass and sampling location consistent across groups.
- For cultured cells, use a consistent harvesting and washing procedure, control the amount of cellular material collected, and stabilize the samples quickly after harvest; cell number, protein content, or another appropriate measure should also be recorded when it will be used for downstream normalization.
- For plant tissues, define the organ, tissue region, developmental stage, and collection time according to the biological question, apply these criteria consistently within each comparison, and rapidly stabilize the material after sampling to limit post-harvest metabolic changes.
Across all matrices, collection, processing, storage temperature, and freeze-thaw history should be standardized as far as possible, because consistent sample handling provides the foundation for reliable downstream lipid extraction and LC-MS/MS analysis.
Step 3: Lipid Extraction for LC-MS/MS Lipidomics
Lipid Extraction for Lipidome Coverage
Lipid extraction isolates lipids from proteins, salts, and other matrix components while determining which lipid classes are efficiently recovered for LC-MS/MS analysis. Because the lipidome includes compounds with widely different polarity and hydrophobicity, from neutral triacylglycerols and cholesteryl esters to glycerophospholipids and sphingolipids, solvent composition and phase partitioning directly influence lipid recovery, matrix removal, and ultimately lipidome coverage. An appropriate extraction method therefore needs to balance broad lipid-class recovery with efficient removal of components that may interfere with chromatographic separation or electrospray ionization.
Chloroform-methanol systems, including the Folch and Bligh-Dyer methods, are widely used for biphasic lipid extraction, while methyl tert-butyl ether (MTBE)-based extraction provides an alternative in which the lipid-containing organic phase forms above the aqueous phase, facilitating phase collection and high-throughput handling (Matyash et al., 2008). The optimal method depends on the sample matrix, lipid classes of interest, required coverage, throughput, and downstream analytical strategy. For a detailed comparison of solvent systems, lipid recovery, and practical method selection, see our MTBE vs. chloroform-methanol lipid extraction guide.
Internal Standards for Lipid Quantification
Internal standards provide reference signals for correcting technical variation and supporting reliable lipid quantification. Stable-isotope-labeled lipids are especially useful because they closely resemble their endogenous counterparts in extraction, chromatography, and ionization while remaining distinguishable by mass spectrometry. When added before extraction, they can account for variation introduced during sample preparation as well as LC-MS/MS analysis; standards added after extraction can correct downstream analytical variation but cannot compensate for lipid losses that occurred during extraction (Kopczynski et al., 2024).
Accurate correction also requires internal standards that appropriately represent the lipids being measured. MS response varies among lipid classes and molecular species because extraction recovery, chromatographic behavior, ionization efficiency, and fragmentation are structure dependent. Lipidomics workflows therefore commonly use class-specific or analyte-specific internal standards where appropriate, particularly when semi-quantitative or absolute measurements are required. The choice, number, and timing of internal standards should match the intended quantification strategy and the lipid classes covered by the assay (Drotleff and Lämmerhofer, 2019; Kopczynski et al., 2024).
Step 4: LC-MS/MS Analysis and Data Acquisition
Liquid Chromatography for Lipid Separation
Liquid chromatography (LC) reduces the complexity presented to the mass spectrometer at any one moment and separates lipids according to physicochemical properties that complement mass-based detection.
Reversed-phase LC (RPLC), commonly using C18 or C30 stationary phases, separates lipids largely through hydrophobic interactions. Retention therefore reflects features such as lipid class, carbon-chain length, and unsaturation. This makes RPLC useful for separating many molecular species within a lipid class. Hydrophilic interaction liquid chromatography (HILIC), in contrast, places greater emphasis on the polar headgroup and can provide strong separation between lipid classes. The appropriate strategy depends on whether the analytical priority is broad molecular-species separation, class-based separation, isomer resolution, or a particular target panel (Züllig et al., 2020).
Chromatographic separation also reduces ion suppression by preventing every extracted compound from reaching the ion source simultaneously. It does not eliminate matrix effects, but it changes when individual lipids enter the source and can improve the analytical environment in which they are ionized.
Ionization in LC-MS Lipidomics
In LC-MS lipidomics, electrospray ionization (ESI) transfers molecules from the liquid phase into gas-phase ions. Different lipid structures form different protonated, deprotonated, or adducted ions, so the same lipid concentration does not automatically produce the same MS response across lipid classes.
Positive- and negative-ion modes provide complementary information because lipid classes differ in their tendency to form stable ions under each condition. Mobile-phase additives can also influence adduct formation and signal behavior. These ion-chemistry differences are one reason why lipidomics quantification requires suitable internal standards and why raw signal intensity cannot be interpreted as a direct molar comparison between chemically different lipid species.
MS/MS Acquisition Strategies
After ionization, mass spectrometry measures precursor ions and, through tandem MS, their fragments. The acquisition strategy determines how systematically fragmentation information is collected.
In DDA, the instrument selects precursor ions - often based on signal intensity - for MS/MS analysis. This can generate relatively clean spectra for selected precursors, but low-abundance ions may receive little or no fragmentation coverage. DIA fragments broader sets of ions within defined windows, increasing systematic MS/MS acquisition while creating more complex spectra that require computational deconvolution. Targeted MRM instead monitors predefined precursor-to-product-ion transitions and is particularly suited to repeated measurement of known lipid targets.
The choice between LC-MS, GC-MS, direct infusion, and specific MS acquisition modes therefore follows the lipid chemistry and analytical question. For a platform-focused comparison, see LC-MS vs. GC-MS in lipidomics.
Step 5: Lipidomics Data Processing, Identification, and Quantification
LC-MS Data Processing and Feature Extraction
Raw LC-MS data contain ion signals distributed across mass-to-charge ratio (m/z), retention time, and signal intensity. Before biological comparisons can be made, these signals must be converted into a structured data matrix.
In untargeted LC-MS workflows, this commonly involves peak detection, chromatographic peak integration, retention-time alignment across samples, grouping or recognition of isotopes and adducts, background filtering, and handling of missing or low-quality features. The purpose is to determine which signals represent reproducibly measurable analytical features and to match corresponding features across the entire sample set.
Targeted workflows start from predefined analytes or transitions, so data processing often focuses more heavily on chromatographic peak integration, signal verification, calibration or normalization, and predefined acceptance criteria. In both cases, data processing determines which measurements are ultimately carried forward; software output is therefore part of the analytical measurement rather than a neutral post-processing step (Züllig et al., 2020; Kopczynski et al., 2024).
Lipid Identification and Structural Annotation
A detected MS feature is not automatically a fully identified lipid. Lipid identification combines evidence such as accurate precursor mass, lipid-class-specific fragments, fatty-acyl-related fragments, retention behavior, spectral-library matches, and, where available, authentic standards.
This distinction matters because lipid structures can differ at several levels. For example, PC 34:1 describes a phosphatidylcholine with a total of 34 carbons and one double bond in its combined chains. Evidence identifying the individual fatty acyl chains may support an annotation such as PC 16:0_18:1, where the underscore indicates that their stereospecific positions are unresolved. Reporting PC 16:0/18:1 implies additional positional information. Double-bond positions and geometries require still deeper structural evidence. The reported lipid name should therefore match the structural resolution actually supported by the experiment (Liebisch et al., 2020; Köfeler et al., 2021).
This hierarchical naming system prevents analytical uncertainty from being hidden behind an overly specific lipid name. MetwareBio's LIPID MAPS lipid classification and nomenclature guide explains these naming levels in more detail, while its guide to common lipidomics databases and software covers resources used during annotation and data analysis.
Lipid Quantification: Relative, Semi-Quantitative, and Absolute
Lipid identification answers what the signal represents; quantification answers how much of that lipid is represented by the measured response. The strength of that quantitative claim depends on the calibration strategy.
Table 2. Comparison of Lipid Quantification Approaches in Lipidomics
| Quantification approach | Typical output | Analytical basis |
|---|---|---|
| Relative quantification | Fold change or normalized abundance between samples | Comparison of consistently processed signals |
| Semi-quantification | Estimated abundance referenced to representative standards | Internal standards and response assumptions, often at lipid-class level |
| Absolute quantification | Concentration in defined units | Appropriate calibration, quantitative standards, and validated response relationships |
Relative measurements can provide robust biological comparisons without claiming a molar concentration. Semi-quantitative approaches improve comparability by referencing lipid signals to suitable internal standards but still rely on assumptions about how the analyte and reference respond. Absolute quantification requires stronger calibration because structurally different lipids can exhibit different extraction recovery, ionization efficiency, and fragmentation response. The Lipidomics Standards Initiative therefore recommends reporting the quantification strategy and internal-standard design explicitly (Kopczynski et al., 2024).
Step 6: Statistical Analysis of Lipidomics Data
Statistical analysis converts the processed lipid abundance matrix into evidence for biological differences between samples or experimental groups. Before group comparisons, lipidomics data may require normalization, transformation, scaling, or correction for documented technical variation so that differences in overall signal intensity or analytical behavior do not obscure the biological effects of interest. The appropriate preprocessing strategy depends on the quantification method, sample matrix, and study design, and its suitability should be evaluated using the structure and quality of the resulting data rather than applying the same normalization method to every dataset (Drotleff and Lämmerhofer, 2019).
Exploratory analyses are then used to understand the overall structure of the lipidomics dataset. Principal component analysis (PCA) summarizes major sources of variation without using predefined group labels, making it useful for assessing sample relationships, detecting outliers, and identifying dominant biological or technical patterns. Differential lipid analysis addresses a different question by testing individual lipid species for changes associated with the experimental condition; appropriate statistical models should reflect the study design, and multiple-testing correction is important when large numbers of lipids are evaluated simultaneously. Heatmaps and clustering can further show whether differential lipids form coordinated abundance patterns across samples or groups.
Supervised methods such as partial least-squares discriminant analysis (PLS-DA) and orthogonal PLS-DA (OPLS-DA) can be used when the objective is to model predefined group differences, but their interpretation depends on appropriate validation because apparent separation in a fitted model does not by itself demonstrate reliable predictive performance (Gromski et al., 2015). Together, these analyses move lipidomics beyond individual abundance measurements by identifying reproducible group-level patterns and candidate differential lipids that can then be examined in their lipid-class, structural, pathway, and biological contexts.
Step 7: Biological Interpretation of Lipidomics Data
Statistically significant lipid changes gain biological meaning when they are interpreted in the context of lipid class, molecular structure, metabolic relationships, and the phenotype under study. Examining differential lipids across these connected levels can reveal coordinated patterns of lipid remodeling and provide a stronger basis for linking lipidomic changes to relevant biological processes and generating testable hypotheses.
- The first level is the individual lipid species. A change in a specific ceramide, phosphatidylcholine, phosphatidylethanolamine, or triacylglycerol may suggest a focused remodeling process, but its meaning depends on the lipid's structure, tissue context, and surrounding pathway.
- The second level is lipid-class and structural remodeling. Coordinated shifts across several members of the same class can reveal information that is difficult to see from isolated species. Researchers can also examine acyl-chain composition, such as whether a lipid class shifts toward longer or shorter chains or toward more saturated or unsaturated species. Metrics such as average chain length (ACL) and average degree of unsaturation (ADU) summarize these compositional patterns when calculated within an appropriate lipid set. A dedicated guide to lipid chain-length and unsaturation analysis using ACL and ADU provides the calculation and interpretation framework.
- The third level connects lipid changes to metabolic pathways and biological processes. Pathway annotation or enrichment can highlight groups of altered lipids associated with glycerophospholipid metabolism, sphingolipid metabolism, fatty-acid pathways, membrane remodeling, or other biochemical systems. These analyses become stronger when the affected lipid species, class-level pattern, relevant enzymes, phenotype, and complementary omics data point toward the same biological process. Pathway enrichment nevertheless represents statistical overrepresentation or association; by itself, it does not demonstrate that a pathway has been activated or inhibited. Mechanistic interpretation generally requires additional evidence such as enzyme activity, transcript or protein changes, isotope tracing, perturbation experiments, or targeted validation (Kyle et al., 2021).
Frequently Asked Questions About Lipidomics Workflows
1. What determines lipid coverage in an LC-MS/MS lipidomics study?
Lipid coverage depends on the sample matrix, extraction method, chromatographic separation, ionization conditions, MS acquisition strategy, and lipid identification criteria. Because lipid classes differ substantially in polarity, chromatographic behavior, and ionization efficiency, no single LC-MS/MS workflow measures all lipids with equal efficiency. Lipid coverage should therefore be evaluated in relation to the lipid classes and biological questions most relevant to the study.
2. Can LC-MS/MS lipidomics distinguish lipid isomers?
LC-MS/MS can distinguish some lipid isomers when chromatographic separation and MS/MS fragmentation provide sufficient structural information, but the achievable resolution depends on the analytical method. Conventional workflows may identify lipid class and fatty-acyl composition without resolving sn-positions, double-bond positions, or double-bond geometry. More detailed structural assignments generally require additional separation, fragmentation, or specialized analytical approaches.
3. Can untargeted lipidomics provide absolute quantification?
Untargeted lipidomics is primarily designed for broad discovery and commonly reports relative abundance rather than absolute concentration. Absolute quantification requires suitable reference standards, calibration, and validated quantitative response for the analytes of interest. Studies that require accurate concentrations of predefined lipids therefore typically use targeted quantitative workflows rather than relying on untargeted feature profiling.
4. Can lipidomics data from different studies or analytical platforms be directly compared?
Direct comparison requires caution because lipid extraction, chromatography, ionization, MS acquisition, annotation criteria, internal standards, and normalization can all influence the reported lipid profile. Even when two studies report the same lipid name, differences in structural resolution or quantification strategy may limit comparability. Cross-study interpretation is more reliable when analytical methods, lipid nomenclature, identification confidence, and quantitative definitions are clearly reported and harmonized.
Plan Your Lipidomics Study with MetwareBio
A useful lipidomics dataset is built through a connected sequence of decisions. Study design establishes what needs to be measured; sample handling preserves the biological state; extraction determines which lipid chemistry enters the analytical system; LC-MS/MS provides separation and structural evidence; and data processing converts instrumental signals into appropriately identified and quantified lipid measurements. Statistical analysis and biological interpretation then determine what those measurements say about the experimental system.
For projects requiring broad, targeted semi-quantitative lipid profiling, MetwareBio’s Quantitative Lipidomics Service integrates lipid extraction, LC-MS/MS measurement, internal-standard-based semi-quantification, quality control, and downstream data analysis within a structured workflow. If you are planning a lipidomics study and would like to determine the most appropriate strategy for your samples and research goals, contact our team to discuss your project requirements.
Contact UsRead More: Lipidomics Strategy, Extraction, and Data Interpretation
These articles complement the current workflow guide by detailing MetwareBio’s quantitative lipidomics platform, MTBE vs. chloroform-methanol extraction trade-offs, step-by-step data interpretation, common sample-preparation FAQs, and the statistical criteria used to prioritize biologically meaningful lipid changes.
Overview of MetwareBio’s quantitative lipidomics platform covering six major lipid categories (FA, GL, GP, SL, ST, PR), with proprietary databases of 4,000+ animal lipids and 1,700+ plant lipids and MTBE-based extraction plus C30 chromatographic separation.
In-depth methodology review covering strategy selection, sample preparation, LC-MS acquisition, internal-standard design, and data interpretation, complementing the seven-step workflow in this blog.
Side-by-side comparison of Folch/Bligh-Dyer and MTBE-based extraction protocols, including recovery for polar phospholipids, automation compatibility, and best-practice tips for robust extraction.
Practical walk-through of data analysis steps from raw processing and normalization through differential lipids, pathway interpretation, and biological validation, useful for researchers new to lipidomics.
Common pre-analytical questions about lipid extraction including oxidation prevention, phase separation, plasma and lymphatic-fluid requirements, and storage, addressing the practical concerns raised in Step 2 of this guide.
A practical guide to the statistical filters used to prioritize biologically meaningful lipid changes, complementing the volcano-plot and multivariate-statistics discussion in Steps 5 and 6 of this workflow.
References
- Drotleff B, Lämmerhofer M. Guidelines for Selection of Internal Standard-Based Normalization Strategies in Untargeted Lipidomic Profiling by LC-HR-MS/MS. Analytical Chemistry. 2019;91(15):9836-9843. https://doi.org/10.1021/acs.analchem.9b01505
- Gromski PS, Muhamadali H, Ellis DI, et al. A tutorial review: Metabolomics and partial least squares-discriminant analysis—A marriage of convenience or a shotgun wedding. Analytica Chimica Acta. 2015;879:10–23. https://doi.org/10.1016/j.aca.2015.02.012
- Köfeler HC, Ahrends R, Baker ES, et al. Recommendations for good practice in MS-based lipidomics. Journal of Lipid Research. 2021;62:100138. https://doi.org/10.1016/j.jlr.2021.100138
- Kopczynski D, Ejsing CS, McDonald JG, et al. The lipidomics reporting checklist: a framework for transparency of lipidomic experiments and repurposing resource data. Journal of Lipid Research. 2024;65(9):100621. https://doi.org/10.1016/j.jlr.2024.100621
- Kyle JE, Aimo L, Bridge AJ, et al. Interpreting the lipidome: bioinformatic approaches to embrace the complexity. Metabolomics. 2021;17(6):55. https://doi.org/10.1007/s11306-021-01802-6
- Liebisch G, Fahy E, Aoki J, et al. Update on LIPID MAPS classification, nomenclature, and shorthand notation for MS-derived lipid structures. Journal of Lipid Research. 2020;61(12):1539-1555. https://doi.org/10.1194/jlr.S120001025
- Matyash V, Liebisch G, Kurzchalia TV, Shevchenko A, Schwudke D. Lipid extraction by methyl-tert-butyl ether for high-throughput lipidomics. Journal of Lipid Research. 2008;49(5):1137-1146. https://doi.org/10.1194/jlr.D700041-JLR200
- Züllig T, Trötzmüller M, Köfeler HC. Lipidomics from sample preparation to data analysis: a primer. Analytical and Bioanalytical Chemistry. 2020;412(10):2191-2209. https://doi.org/10.1007/s00216-019-02241-y