Metabolism is spatially organized and continuously changing, yet conventional metabolomics usually measures averaged metabolite abundance after tissue homogenization. Spatial metabolomics adds molecular location, while stable isotope tracing adds information about nutrient fate and pathway activity. Integrating stable isotope tracers with mass spectrometry imaging (MSI) therefore enables spatially resolved mapping of nutrient fate and metabolic activity across organs, tissue regions, and, in selected workflows, near-cellular scales. This article explains how spatial isotope tracing works, compares the main MSI approaches, reviews computational tools such as MSITracer, MET-MAP, and IsoScope, and examines recent applications in inter-organ metabolic communication and tissue metabolic zonation. It also clarifies what current MSI-based tracing can and cannot quantify, helping researchers interpret spatial metabolic activity without overstating flux measurements.
1. What Is Spatial Metabolic Flux Mapping?
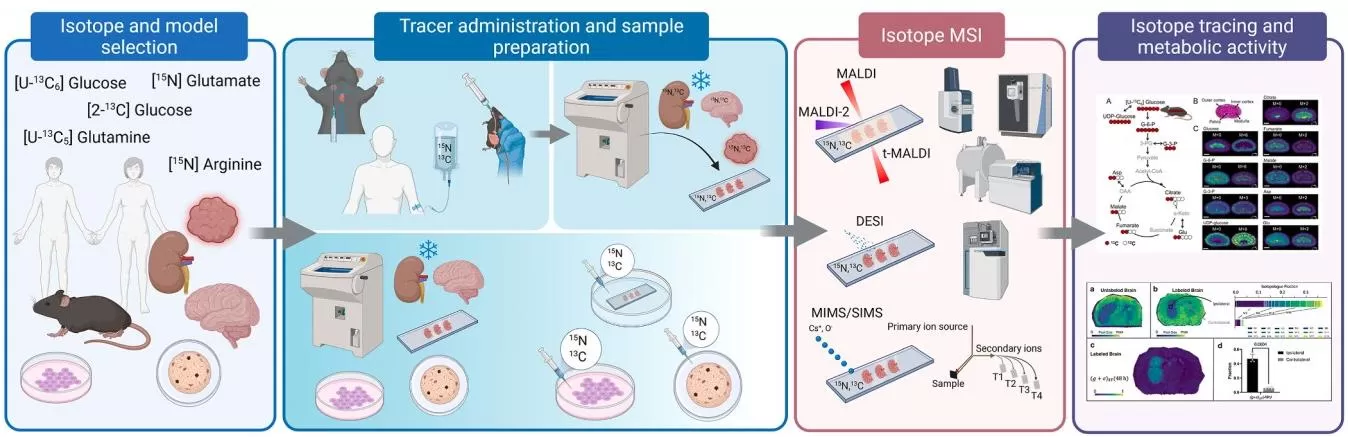
Spatial metabolic flux mapping integrates stable isotope tracing with spatially resolved analytical techniques, most commonly mass spectrometry imaging (MSI), to investigate how defined nutrients are metabolized across different regions of tissues or organs. Stable isotope tracers such as 13C-labeled glucose or glutamine enter endogenous metabolic pathways and generate labeled downstream metabolites, or isotopologues. MSI then maps these labeled signals while preserving their spatial coordinates, allowing researchers to visualize regional differences in nutrient utilization and metabolic activity.
Several related terms are often used in this field but should be distinguished. Spatial isotope tracing refers specifically to mapping the incorporation of isotope-labeled substrates across biological space and is therefore the most direct description of the experimental strategy. Dynamic spatial metabolomics is broader and may also include spatial changes in metabolite abundance measured across serial time points without isotope tracers. Spatial metabolic flux emphasizes the goal of resolving metabolic flow across space, but isotope enrichment or labeling fractions alone are not equivalent to absolute reaction fluxes. Rigorous flux quantification generally requires additional kinetic measurements, metabolite-pool information, and metabolic modeling (Kostidis et al., 2026).
Recent advances in tracer design, MSI platforms, and computational analysis have expanded spatial isotope tracing from regional metabolic activity mapping toward tissue metabolic topography and inter-organ metabolic exchange (Wang et al., 2022; Li et al., 2025; Samarah et al., 2025; Kostidis et al., 2026).
2. Why Combine Stable Isotope Tracing with Spatial Metabolomics?
The key advantage of spatial metabolic flux mapping is that it combines information that conventional metabolomics methods provide only separately. Bulk metabolomics measures overall metabolite abundance but averages signals across heterogeneous tissue regions. Conventional isotope tracing reveals nutrient fate and pathway activity but usually loses anatomical context during tissue extraction. Spatial metabolomics preserves molecular location but primarily provides a static map of metabolite abundance. Spatial isotope tracing connects these dimensions by showing where a defined nutrient is used, which metabolites receive tracer-derived atoms, and how metabolic activity varies across tissue space.
This combination is especially valuable in organs with strong metabolic zonation or heterogeneous microenvironments. It can distinguish regional differences in substrate utilization that are obscured by bulk analysis, help separate metabolite accumulation from active pathway use, and reveal metabolic communication between tissue compartments or organs.
| Approach | Main Information Provided | Spatial Context | Dynamic Tracer Information | Main Limitation |
|---|---|---|---|---|
| Bulk metabolomics | Metabolite abundance | No | No | Averages tissue heterogeneity |
| Conventional isotope tracing | Nutrient fate and pathway activity | Usually no | Yes | Loses anatomical localization |
| Spatial metabolomics | Spatial metabolite distribution | Yes | No | Abundance does not directly indicate pathway activity |
| Spatial metabolic flux mapping | Spatial isotope incorporation, nutrient fate, and regional metabolic activity | Yes | Yes | Absolute flux estimation requires additional kinetic modeling |
By integrating spatial location with isotope-derived metabolic information, spatial metabolic flux mapping moves metabolomics from describing where metabolites are present toward explaining where and how nutrients are being metabolized.
3. Core Technologies for Spatial Metabolic Flux Mapping
Spatial metabolic flux mapping relies on two complementary experimental components: stable isotope tracing to introduce trackable metabolic labels and mass spectrometry imaging (MSI) to localize labeled metabolites within tissue space. Tracer selection determines which metabolic routes can be interrogated, while the MSI platform determines the achievable spatial resolution, molecular coverage, and sensitivity for detecting isotopologues. Together, these technologies provide the experimental basis for resolving nutrient fate and regional metabolic activity across heterogeneous tissues.
3.1 Stable-Isotope Tracer Design
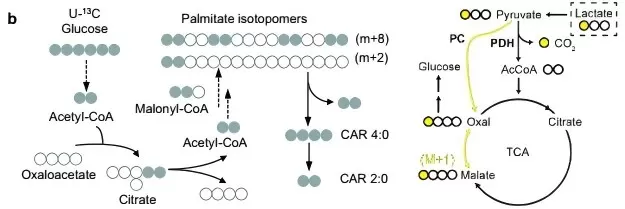
Tracer selection determines which biochemical routes can be interrogated. Uniformly labeled tracers, such as [U-13C6]glucose or [U-13C5]glutamine, label all carbon atoms in the supplied substrate. They are useful for broadly following carbon transfer into measurable downstream metabolites across pathways such as glycolysis, the tricarboxylic acid (TCA) cycle, amino acid metabolism, and lipid synthesis. Position-specific tracers, such as [1-13C]lactate, label selected atoms and can help distinguish reaction routes or pathway branches when different biochemical transformations generate characteristic isotopologue patterns.
Tracer choice must also match the biological question and experimental system. The administered dose, delivery route, labeling duration, tissue collection timing, and physiological state influence isotope enrichment and interpretation. A short labeling interval may emphasize direct substrate use, whereas longer exposure can introduce secondary labeling through metabolite recycling and inter-organ exchange. For this reason, isotopologue patterns should be interpreted in the context of tracer kinetics rather than as simple binary evidence that a pathway is present or absent (Kostidis et al., 2026).
3.2 Mass Spectrometry Imaging for Spatial Isotope Tracing
MSI measures a mass spectrum at spatially defined positions across a tissue surface. For isotope tracing, the platform must resolve the native metabolite and its labeled isotopologues while retaining sufficient spatial resolution and signal-to-noise ratio. No single ionization method is optimal for every tracer, tissue, and metabolite class.
- AFADESI-MSI is an ambient ionization approach in which airflow-assisted desorption electrospray ionization samples molecules directly from tissue. It can provide broad metabolite coverage with relatively limited sample preparation and has been used for whole-body and multi-organ isotope tracing (Li et al., 2025). Its strengths are particularly relevant when broad molecular coverage and large tissue fields are more important than near-cellular spatial resolution.
- MALDI-MSI uses a laser-absorbing matrix deposited on tissue before rasterized laser acquisition. It is widely used for spatial metabolomics and isotope tracing because it supports diverse metabolite and lipid classes and can achieve micrometer-scale imaging under optimized conditions. Spatial resolution is method-dependent and involves a sensitivity–resolution trade-off; Samarah et al., for example, reported 15 μm imaging in liver and 10 μm or 5 μm imaging in intestine (Samarah et al., 2025; Kostidis et al., 2026).
- SIMS and multi-isotope imaging mass spectrometry (MIMS) use focused primary ion beams and can localize isotope enrichment at subcellular or even nanometer-scale spatial resolution. Their advantage is extremely fine isotope localization, but extensive fragmentation and limited intact-molecule information constrain broad metabolite identification compared with softer ionization approaches. They are therefore particularly useful when isotope localization at very high spatial resolution is the primary objective (Kostidis et al., 2026).
| MSI approach | Strength for isotope tracing | Main trade-off |
|---|---|---|
| AFADESI-MSI | Broad metabolite coverage and large tissue fields under ambient conditions. | Spatial resolution is generally lower than high-resolution MALDI or SIMS; adduct and ion-suppression complexity must be managed. |
| MALDI-MSI | Flexible metabolite/lipid imaging with micrometer-scale pixel sizes in optimized workflows. | Smaller pixels reduce sampled material per pixel, creating a sensitivity-resolution trade-off; matrix preparation affects performance. |
| SIMS / MIMS | Very high spatial resolution for isotope localization, including subcellular structures. | Greater fragmentation and more limited intact-molecule coverage than softer ionization approaches. |
4. Computational Tools for Spatial Metabolic Flux Mapping
Computational analysis plays several complementary roles in spatial metabolic flux mapping. Isotope-focused tools such as MSITracer and IsoScope identify labeled isotopologues, correct for natural isotope abundance, and quantify spatial labeling patterns. Other approaches, such as MET-MAP, characterize the underlying spatial organization of metabolite abundance and provide a metabolic coordinate system in which tracer-derived activity can be interpreted. Together, these computational strategies connect isotope incorporation with tissue metabolic architecture and support more reliable interpretation of spatial metabolic heterogeneity.
4.1 MSITracer: Automated Isotopologue Mapping for MSI
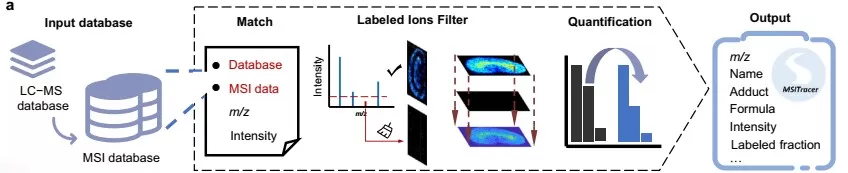
MSITracer was developed for spatial isotope tracing using MSI data and was reported by Li et al. (2025). The workflow uses metabolite information established by LC-MS/MS tracing experiments to construct an MSI-specific database that includes experimentally observed and theoretically predicted adduct ions. It then extracts targeted isotopologue intensities, filters ion groups that lack sufficient imaging or tracer-derived signal, corrects for natural isotope abundance, and calculates labeling fractions. This architecture is important because adduct formation can differ between LC-MS and MSI, making direct transfer of an LC-MS feature list insufficient for robust imaging analysis.
By applying MSITracer to [U-13C6]glucose and [U-13C5]glutamine tracing, the study compared isotope incorporation across whole-body sections and heterogeneous tissue regions. The software therefore supports quantitative comparison of labeling patterns and spatial metabolic activity, but its labeling fractions should still be distinguished from absolute pathway flux unless kinetic and model-based flux estimation is performed.
4.2 MET-MAP: Learning Spatial Metabolic Topography
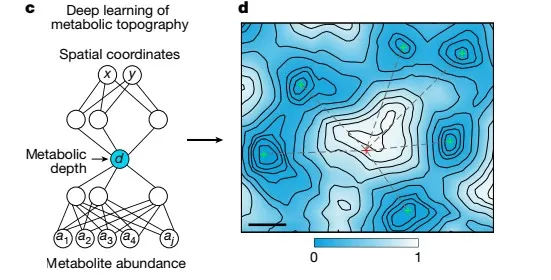
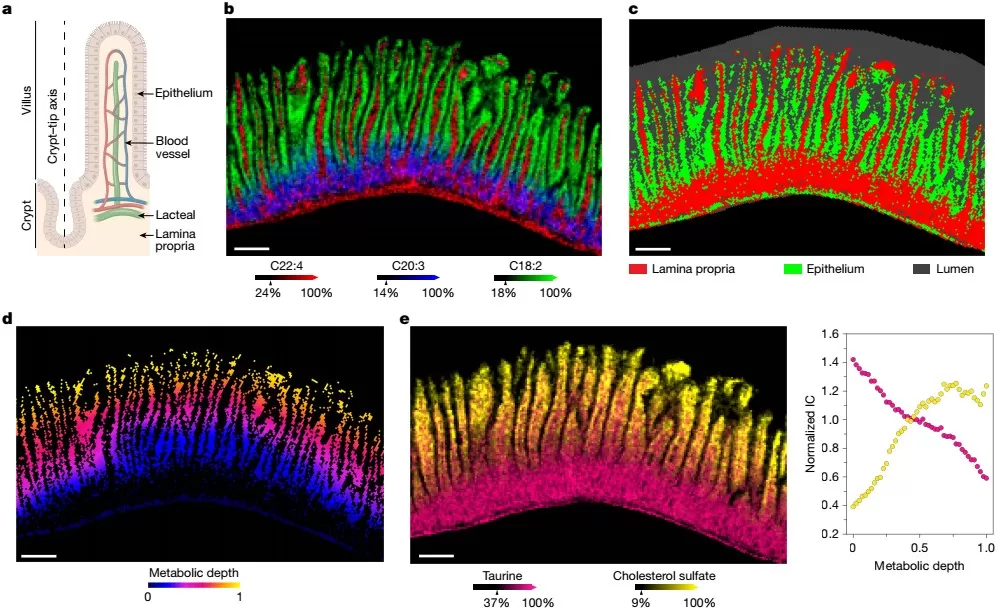
MET-MAP, or Metabolic Topography Mapper, addresses a related but distinct analytical problem. Rather than serving primarily as an isotopologue-extraction tool, MET-MAP uses deep learning to infer low-dimensional spatial coordinates from high-dimensional metabolite-abundance images (Samarah et al., 2025). In liver, the model learned a metabolic depth corresponding closely to the portal-central axis without requiring the anatomical position to be supplied as the training target. In intestine, the approach captured dominant metabolic organization across recurring crypt-villus structures.
This distinction matters for interpretation. MET-MAP organizes spatial metabolic abundance patterns, while isotope-tracing measurements can then be projected onto or interpreted within the inferred metabolic topology. Combining these layers helps connect where metabolites accumulate with where labeled nutrients are being metabolized, providing a more mechanistic view of tissue zonation than abundance imaging alone.
4.3 IsoScope: Spatial Labeling Fractions Linked to Tissue Anatomy
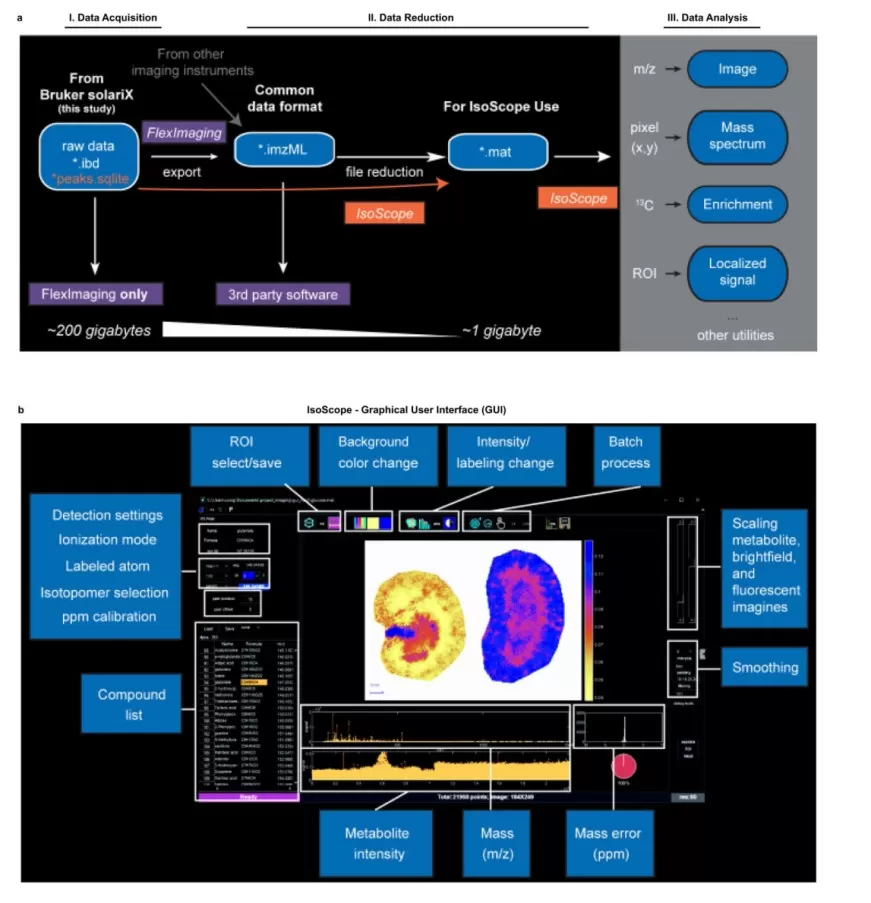
IsoScope was introduced with MALDI-based isotope imaging to process spatial tracer data and calculate corrected isotope-labeling fractions (Wang et al., 2022). The workflow supports isotope signal extraction, natural isotope correction, and generation of spatial enrichment images. It can also align metabolic images with histological or fluorescence information, allowing isotope incorporation to be interpreted in anatomically defined tissue regions.
In the original study, this framework revealed spatially distinct metabolic activity in kidney and brain. For example, isotope tracing differentiated gluconeogenic and glycolytic activity between kidney regions and identified regional differences in the carbon and nitrogen sources contributing to brain metabolism (Wang et al., 2022). These results illustrate the value of combining biochemical tracing with anatomical co-registration rather than interpreting labeled signals without tissue context.
5. Biological Applications of Spatial Metabolic Flux Mapping
The biological value of spatial isotope tracing becomes clearest when a tissue or organism contains metabolically distinct compartments that would be averaged together by bulk analysis. Two recent application areas demonstrate this advantage: metabolic communication among organs and metabolic zonation within individual tissues.
5.1 Inter-Organ Metabolic Communication and Nutrient Exchange
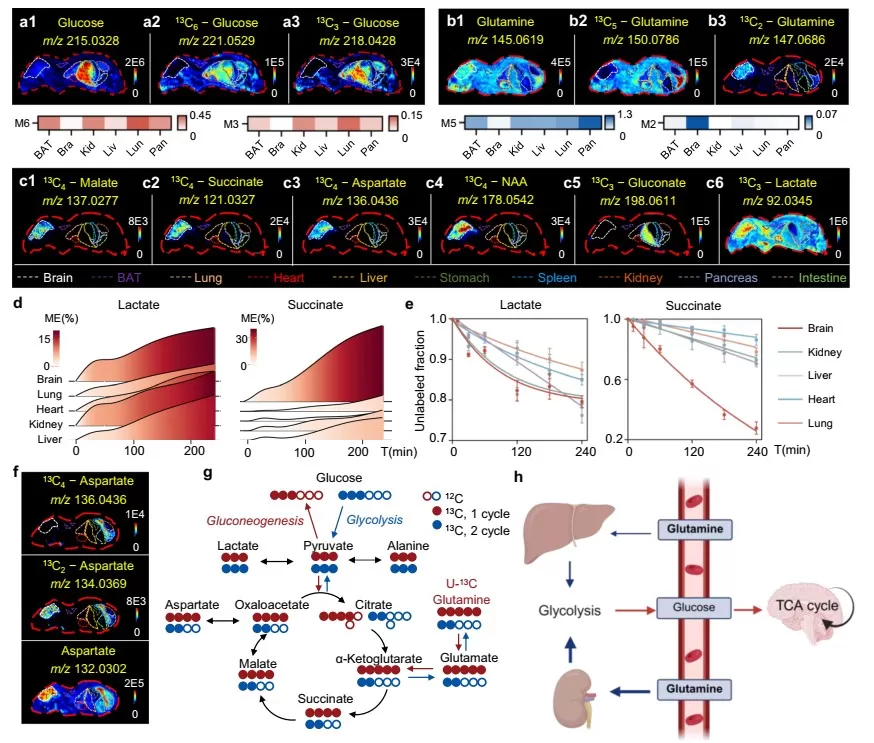
Whole-body isotope tracing can reveal how the same circulating nutrient is processed differently among organs. Li et al. combined in vivo 13C tracing, LC-MS/MS, AFADESI-MSI, and MSITracer to compare glucose- and glutamine-derived labeling across multiple tissues (Li et al., 2025). The resulting maps showed organ-specific uptake and downstream isotopologue patterns, while time-course sampling demonstrated that labeled metabolites can exhibit markedly different kinetics among organs. Such data provide a spatial framework for distinguishing local metabolism from metabolites that are produced in one tissue and redistributed through the circulation.
The study also used isotopologue patterns to investigate lipid exchange. Newly synthesized fatty-acid labeling was prominent in brown adipose tissue and brain, whereas the liver showed labeling patterns consistent with incorporation of glucose-derived glycerol backbones into triglycerides. Similarity between liver and serum lipid isotopologue distributions supported a model in which liver-derived lipids contribute to circulating substrates used by other organs, including the heart. These findings support inter-organ metabolic exchange, although the direction and magnitude of transfer should be interpreted as a model supported by the reported tracer data rather than as a universal pathway under all physiological conditions (Li et al., 2025).
In tumor-bearing mice, the same framework showed that tumor burden altered host metabolic labeling and suggested that glucose-derived glutamine released from the lung could contribute to tumor glutamate synthesis (Li et al., 2025). This illustrates an important extension of spatial isotope tracing: metabolic communication can be studied not only among healthy organs but also between diseased tissue and the host organism.
5.2 Tissue Metabolic Zonation and Regional Heterogeneity
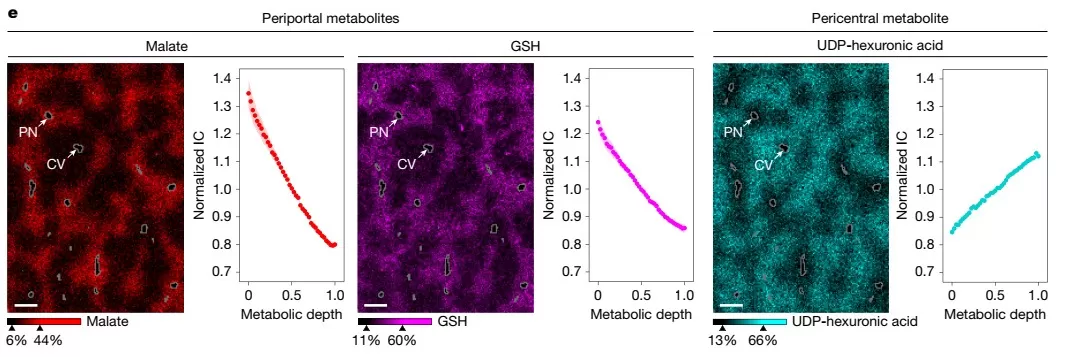
Spatial isotope tracing is also suited to organs whose cells are organized along reproducible anatomical gradients. Samarah et al. used high-resolution MALDI-MSI and MET-MAP to characterize mouse liver lobules and small-intestinal villi, then added isotope tracing to determine whether abundance gradients reflected differences in pathway activity (Samarah et al., 2025). More than 90% of the measured metabolites showed significant spatial concentration gradients in these tissues, demonstrating that metabolic organization is a major component of tissue architecture.
In liver, TCA-cycle intermediates such as malate and aspartate were enriched periportally, and labeling from both glutamine and lactate likewise localized preferentially to the periportal region. Energy-stress metabolites including AMP were also periportal, consistent with high local energy demand. These findings correct a common interpretive trap: a spatial metabolite gradient should not be assigned to a pathway solely from abundance. The tracer data provided independent evidence that TCA-related substrate use and oxidative metabolism were spatially organized along the portal-central axis (Samarah et al., 2025).
The small intestine showed a different form of zonation. Citrate was relatively enriched toward crypt regions, whereas malate was enriched toward villus tips. Isotope tracing was consistent with stronger glutamine catabolism at the tips and greater lactate oxidation in crypts. The study further followed orally administered labeled fructose: intestinal fructose metabolism occurred faster near the villus bottom than at the tips, while excess fructose-derived carbon reaching the liver accumulated pericentrally as fructose-1-phosphate and was associated with focal pericentral ATP depletion (Samarah et al., 2025). These results show how abundance imaging and tracer fate can be integrated to connect tissue structure with local metabolic activity.
6. Quantitative Capabilities and Limits of Spatial Isotope Tracing
The phrase "spatial metabolic flux" is useful for describing the goal of resolving metabolic flow across tissue space, but the quantitative level of the output depends on experimental design. A corrected labeling fraction reports the proportion of a metabolite pool carrying tracer-derived isotope under the measured conditions. Isotopologue patterns can reveal substrate contribution, pathway routing, and regional differences in metabolic activity. Time-course labeling can add information about turnover and labeling rates. None of these measurements alone is equivalent to an absolute reaction rate in units such as amount per tissue mass per unit time (Kostidis et al., 2026).
Quantitative metabolic flux analysis requires additional information and modeling. Depending on the system, this may include metabolite pool sizes, multiple time points, tracer input functions, stoichiometric network constraints, and assumptions about metabolic or isotopic steady state. Recent computational development is moving the field toward more explicit flux estimation. In 2026, Li et al. (2026) described MSIFluxer, which combines isotopologue correction with optimization-based fitting to estimate relative metabolic fluxes across pathways from MSI tracing data. Such methods narrow the gap between spatial isotope enrichment and formal flux analysis, but systemic and absolute flux estimation from MSI remains methodologically challenging (Kostidis et al., 2026; Li et al., 2026).
Several analytical constraints also affect interpretation. Spectral overlap becomes more complex as multiple isotopologues and adducts accumulate. Ion suppression and matrix effects can vary across tissue regions, complicating direct intensity comparisons. Higher spatial resolution usually reduces sampled material per pixel and can lower signal-to-noise ratio. Tracer dose and labeling duration can perturb physiology or increase secondary labeling. Finally, metabolite identification confidence remains critical because an accurately mapped isotope pattern is only biologically meaningful if the underlying molecular assignment is reliable. Complementary LC-MS/MS, histology, targeted validation, and appropriate controls therefore remain important components of rigorous spatial tracing studies (Li et al., 2025; Samarah et al., 2025; Kostidis et al., 2026; Wang et al., 2022).
7. Future Directions in Spatial Metabolic Flux Mapping
MSI-based stable isotope tracing is shifting spatial metabolomics from static molecular maps toward spatially resolved measurements of nutrient use, pathway activity, and metabolic exchange. Current studies already demonstrate three scales of analysis: organ-to-organ communication, intratissue metabolic zonation, and near-cellular metabolic heterogeneity. Continued gains in spatial resolution, mass resolution, sensitivity, and isotopologue modeling will determine how broadly these approaches can move from qualitative or relative activity maps toward quantitative flux estimates.
The next step is likely to be integration rather than resolution alone. Co-registration with histology, imaging-based cell typing, spatial transcriptomics, and spatial proteomics can connect tracer-defined metabolic activity with cell identity, enzyme expression, and tissue architecture. At the same time, more standardized workflows for tracer administration, isotope correction, metabolite identification, and reporting will be needed to make spatial flux measurements comparable across laboratories (Kostidis et al., 2026). Human tissue applications also require careful consideration because in vivo tracer administration, tissue access, and clinical sampling impose constraints that are less restrictive in animal models.
Spatial metabolic flux mapping should therefore be viewed as a continuum of measurements rather than a single assay. At one end, MSI visualizes where labeled metabolites appear and quantifies regional isotope enrichment. At the other, kinetic experiments and model-based analysis estimate relative or absolute metabolic fluxes. Recognizing this continuum allows researchers to choose the level of analysis that matches the biological question while avoiding conclusions that exceed the information contained in the tracer data.
Explore Spatial Metabolism with Mass Spectrometry Imaging
Studying metabolic heterogeneity across tissues or anatomical regions? MetwareBio’s spatial metabolomics solutions use mass spectrometry imaging to map metabolite and lipid distributions directly in tissue sections. Our team can help evaluate sample type, spatial resolution, molecular coverage, and the MSI strategy best suited to your biological question.
Explore Spatial Metabolomics ServicesUntargeted Spatial Metabolomics
Maps 1,400+ compounds directly in tissue sections using MALDI-MSI and AFADESI-MSI with 5–100 µm resolution and MetwareBio’s in-house databases.
Spatial Metabolomics Based on Mass Spectrometry Imaging: Mapping Molecular Landscape
Explains how MSI “Paints” molecular landscapes, the label-free advantage, and applications across cancer, neuroscience, and plant biology.
Spatial Omics Services: Spatial Context, Molecular Clarity
Overview of MetwareBio’s spatial omics portfolio — spatial metabolomics, spatial lipidomics, spatial transcriptomics, and integrated multi-omics capabilities.
What Is Central Carbon Metabolism?
Background on stable isotope tracing, metabolomics, and fluxomics for central carbon pathways — the foundation that makes spatial flux mapping interpretable.
Neurotransmitter Spatial Profiling
MALDI-MSI based on the Bruker timsTOF fleX platform, mapping 34 neurotransmitters across brain regions with trace-level derivatization for sensitivity.
Untargeted Spatial Lipidomics
MALDI-MSI-based spatial lipidomics at 5–100 µm resolution with 2,900+ in-house lipids — complementary to spatial flux of lipid metabolism.
References
- Li X, Zhu Y, Li T, et al. Spatial isotope deep tracing deciphers inter-tissue metabolic crosstalk. Nature Communications. 2025;16:7934. https://doi.org/10.1038/s41467-025-63243-2
- Samarah LZ, Zheng C, Xing X, et al. Spatial metabolic gradients in the liver and small intestine. Nature. 2025;648:182-190. https://doi.org/10.1038/s41586-025-09616-5
- Kostidis S, Mörk H, Rabelink TJ, Giera M, Ogrinc N. Mapping metabolism using stable isotope tracers in combination with mass spectrometry imaging. TrAC Trends in Analytical Chemistry. 2026;196:118679. https://doi.org/10.1016/j.trac.2026.118679
- Wang L, Xing X, Zeng X, et al. Spatially resolved isotope tracing reveals tissue metabolic activity. Nature Methods. 2022;19(2):223-230. https://doi.org/10.1038/s41592-021-01378-y
- Li T, Zang QC, Zhu S, et al. Spatial metabolic fluxes reveal tissue metabolic heterogeneity by integrating mass spectrometry imaging and stable isotope tracing. Journal of Pharmaceutical Analysis. 2026;101707. https://doi.org/10.1016/j.jpha.2026.101707