Why might quality control criteria that perform well for peripheral blood mononuclear cells (PBMCs) inadvertently exclude tumor cells, cardiomyocytes, or valuable rare cell populations? The answer lies not in applying increasingly stringent thresholds, but in distinguishing technical noise from genuine biological variation. Quality control (QC) in single-cell RNA sequencing (scRNA-seq) is not intended to eliminate as many cells as possible. Instead, its purpose is to preserve reliable biological signals while identifying technical artifacts, including empty droplets, damaged cells, ambient RNA contamination, and doublets. Following the typical sequence of a scRNA-seq project, this article discusses commonly used QC metrics, approaches to threshold selection, and tissue-specific considerations. Drawing on the official Seurat tutorial and published studies of ambient RNA correction, it also illustrates how QC decisions can be evaluated and validated in practice.
I. Quality Control Is a Continuous Process, Not a Single Step
Many analytical workflows begin by filtering cells from the expression matrix generated by Cell Ranger. However, by that stage, some problems introduced during sample preparation can no longer be fully resolved computationally. For example, overdigestion of tissue may distort cell-type composition, cell aggregates may give rise to doublets, and large numbers of dead cells may increase the amount of extracellular RNA. The 10x Genomics cell preparation guidelines therefore emphasize minimizing cell aggregates, dead cells, noncellular nucleic acids, and reaction inhibitors.
| Stage | Key QC checks | Recommended action if abnormalities are detected |
|---|---|---|
| Sample preparation and before loading | Cell/nucleus integrity, viability, aggregates, debris, dissociation time | Optimize tissue dissociation and remove debris; choose a single-cell or single-nucleus workflow based on tissue characteristics |
| Sequencing and initial processing | Q30, valid barcodes, alignment, reads per cell, sequencing saturation, barcode-rank distribution | Review sequencing depth, library quality, and the reference genome; examine cell-calling results |
| Expression matrix QC | UMI counts, detected gene counts, MT%, Hb%, unusually highly expressed genes | Inspect distributions by sample and flag potentially problematic cells using multiple metrics |
| Post-filtering assessment | Retained cell counts, key cell populations, group imbalance, unexpected marker expression | Reassess thresholds and biological interpretations; perform sensitivity analyses where necessary |
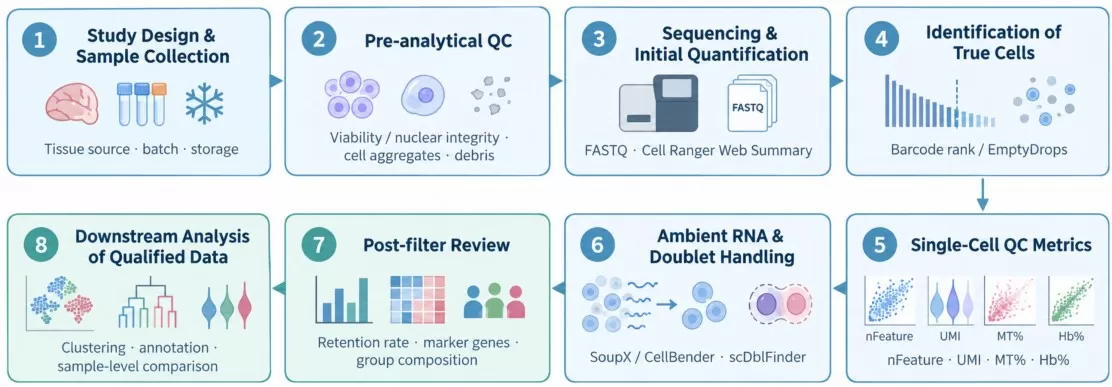
Figure 1 | Overview of the scRNA-seq QC workflow, from sample preparation through downstream analysis.
II. Common QC Metrics: What Do They Actually Measure?
1. Total UMI Count (nCount_RNA)
The total unique molecular identifier (UMI) count reflects the number of captured transcript molecules per cell after deduplication. Very low UMI counts often indicate empty droplets or cellular debris containing only small amounts of free RNA, with limited value for downstream analysis. Conversely, exceptionally high UMI counts may indicate doublets, in which transcripts from two cells are combined, or genuine large cells with intrinsically high transcriptional activity, such as megakaryocytes or activated immune cells. Absolute UMI counts are difficult to interpret in isolation and should be assessed alongside the number of detected genes. Because these two metrics are generally strongly positively correlated, cells that deviate substantially from this relationship merit closer examination.
2. Number of Detected Genes (nFeature_RNA)
The number of detected genes is defined as the number of genes with nonzero UMI counts in an individual cell. Although UMI counts and detected gene counts are generally positively correlated, both depend on cell type, RNA content, capture efficiency, and sequencing depth. Low values for both metrics may indicate empty droplets, cells with inherently low RNA content, or damaged cells. High values, in contrast, may reflect either doublets or genuine transcriptionally active cells. Rather than relying on a single cutoff, it is advisable to examine scatter plots of UMI counts versus detected gene counts, together with violin plots for each sample. Detected gene count is among the most widely used QC metrics. For mammalian cells, approximately 200–6,000 detected genes is often used as a reference range, but it is not a universal criterion: distributions can differ substantially among species, tissues, and cell types. For example, the median number of genes detected in mouse hepatocytes may be considerably higher than that in mouse lymphocytes.
3. Proportion of Mitochondrial Transcripts (Percent.mt)
The mitochondrial transcript proportion is the percentage of total UMIs assigned to mitochondrial genes. An elevated proportion may reflect membrane damage, loss of cytoplasmic RNA, or cellular stress, but it is not definitive evidence of cell death. Metabolically active cells, for example, may exhibit different baseline levels of mitochondrial transcripts, and the expected distributions vary across tissues and sequencing protocols. When MT% is elevated, UMI counts, detected gene counts, cell identity, and the sample preparation history should be evaluated together.
Gene naming conventions also require attention. Human mitochondrial genes generally begin with “MT-”, whereas their mouse counterparts commonly begin with “mt-”. Annotation conventions can differ for plants and nonmodel organisms. Using an incorrect regular expression may therefore produce mitochondrial proportions close to zero across all cells.
Not every cell with an elevated mitochondrial transcript proportion is of poor quality. Some cell types naturally contain relatively large numbers of mitochondria, including:
• Cardiomyocytes, in which mitochondria occupy approximately 30%–40% of cellular volume and mitochondrial transcript levels may consequently be high;
• Renal tubular epithelial cells and skeletal muscle cells, which have high energy demands and are naturally rich in mitochondria;
• Certain metabolically active tumor cells.
Applying a uniform mitochondrial threshold without considering cell type may therefore eliminate genuine cells of interest.
4. Hemoglobin Transcript Proportion (Percent.Hb) and Erythroid Signals
Hemoglobin genes, including HBA1, HBA2, and HBB, warrant particular attention in blood, bone marrow, and highly vascularized tissues. However, a high Hb% does not necessarily identify an artifactual cell. Erythroid precursors and reticulocytes may contain substantial erythroid-associated RNA; although mature erythrocytes lack nuclei, their overall RNA content is much lower than that of nucleated erythroid cells. It is therefore important to distinguish genuine erythroid populations from blood contamination, cellular debris, and extracellular RNA. A cell with plausible UMI and gene counts and a coherent erythroid marker profile, including ALAS2 and GYPA, may represent a genuine erythroid cell. By contrast, weak, diffuse HBB expression across unrelated cell populations should prompt investigation of ambient RNA contamination.
In particular, erythrocyte debris should be distinguished from nucleated erythroid precursors, such as proerythroblasts and normoblasts. These precursors are genuine cell types and, despite their high expression of hemoglobin genes, may also have plausible detected gene and UMI counts. They should not be discarded as technical noise solely on the basis of Hb%. Instead, decisions should consider the combined patterns of detected gene counts, total UMI counts, and hemoglobin transcript proportions.
5. Doublets
Doublets arise when two or more cells are captured within the same droplet. Because their expression profiles contain transcripts from multiple cells, they may form artificial intermediate clusters during clustering and compromise cell-type annotation. DoubletFinder is a commonly used detection tool that follows three main steps:
1) Generate artificial doublets by combining expression profiles from two randomly selected real cells;
2) Assess the similarity between real cells and artificial doublets in principal component analysis (PCA) space;
3) Assign a doublet score to each cell, with higher scores indicating greater likelihood of a doublet.
DoubletFinder requires an expected doublet-rate parameter, often estimated using empirical values from 10x Genomics. This rate depends on cell loading conditions and is commonly assumed to be approximately 5%–10% in the examples discussed here.
6. Additional QC Signals That Are Often Overlooked
| QC signal | Potential interpretation | Important considerations |
|---|---|---|
| Ribosomal gene proportion | Variation in cell type, cellular stress, or library composition | Do not exclude cells on the basis of this proportion alone |
| Fraction of counts from the top 10–20 genes | A small number of transcripts dominate the library, indicating low complexity | Interpret alongside total UMI and detected gene counts |
| Stress and immediate-early genes | Dissociation-associated changes in FOS, JUN, and related genes | May also reflect a genuine response to stimulation; consider processing time and experimental conditions |
| Cell-cycle score | Differences in cell-cycle state influence expression profiles | An explanatory variable, not a universal indicator of poor cell quality |
| Proportion of intronic reads | Single-nucleus datasets generally contain more unspliced transcripts | Evaluate the reference transcriptome, processing parameters, and nuclear isolation procedure |
III. Evaluate Sample-Level Sequencing Quality Before Setting Cell-Level Thresholds
Even when cell-level distributions of nFeature and MT% appear reasonable, overall sequencing or library quality may still constrain downstream analyses. The first step should therefore be to review the Cell Ranger web summary, or the corresponding report from another platform. Key metrics include the barcode-rank plot (knee and cliff), Estimated Cells, Mean Reads per Cell, Median Genes/UMIs per Cell, Fraction Reads in Cells, alignment metrics, and Sequencing Saturation.
A low Fraction Reads in Cells may indicate increased ambient RNA, but it can also result from inadequate identification of cells with low RNA content. High sequencing saturation indicates that additional sequencing is likely to yield progressively fewer new UMIs; it does not necessarily imply superior sample or library quality. Metric names may also vary between Cell Ranger versions.
In practice, a low median detected gene count should not automatically be interpreted as sequencing failure. First consider the cell types present, reads per cell, and sequencing-depth downsampling curves. Published QC examples from 10x Genomics show that neutrophils may naturally yield fewer detected genes than typical PBMC subsets.
IV. Setting QC Thresholds: From Tutorial Cutoffs to Data-Driven Decisions
1. Fixed Thresholds Are Useful Starting Points, Not Universal Standards
Cutoffs such as 200–6,000 detected genes, MT% <20%, and Hb% <5% may provide an initial screening framework for some sample types, but they are not universally applicable acceptance criteria. For instance, the official Seurat PBMC 3K tutorial demonstrates filtering cells with 200–2,500 detected genes and a mitochondrial transcript proportion below 5%. These settings were selected for that specific PBMC teaching dataset and should not be transferred uncritically to other tissues [1].
Similarly, requiring a gene to be expressed in at least three cells is a feature-filtering step applied to the expression matrix, not a cell-level quality criterion. Gene filtering should also be approached carefully when the research objective involves rare cell populations or their marker genes.
2. A More Generalizable Approach: Sample-Specific Distributions and Robust Outlier Detection
For samples within the same experiment, distributions of nCount, nFeature, and MT% should first be examined separately. Median absolute deviation (MAD) can then be used to identify values in the tails of these distributions. Single-cell Best Practices describes an approach using approximately 5 MAD to flag outliers in UMI counts or detected gene counts, while emphasizing that filtering should remain relatively permissive and its effects should be verifiable. Its recommendations for mitochondrial filtering are provided as separate examples rather than universal rules.
MAD-based thresholds help reduce the subjectivity associated with manually selecting fixed cutoffs. Nevertheless, when cell populations are highly heterogeneous, low-quality cells predominate, or a rare population differs markedly from the majority, a statistical outlier need not be a biologically invalid cell. Where appropriate, cell populations should be identified before the filtering strategy is reassessed.
| Sample type | Major QC concerns | Recommended assessment |
|---|---|---|
| PBMCs / immune cells | Low RNA content in small lymphocytes; erythroid and ambient RNA contamination | Use PBMC tutorials as a reference, but inspect cell-type distributions and avoid excessively restrictive lower cutoffs |
| Solid tumors, liver, kidney | Dissociation-induced damage, necrosis, ambient RNA, cell-size variation | Account for tissue-specific background; evaluate MT%, cell-type markers, and ambient RNA correction |
| Cardiomyocytes or highly metabolic tissues | Genuine cells may have elevated MT% | Avoid a universal MT% cutoff; examine whether cells have coherent expression profiles |
| Single-nucleus RNA-seq (snRNA-seq) | Nuclear RNA content and intronic read proportions differ from whole-cell data | Assess intronic counts and establish QC distributions specifically for nuclear data |
| Plant cells / nuclei | Protoplast isolation bias, chloroplast transcripts, annotation differences | Evaluate organellar RNA by species and tissue; use separate criteria for nuclei and protoplasts |
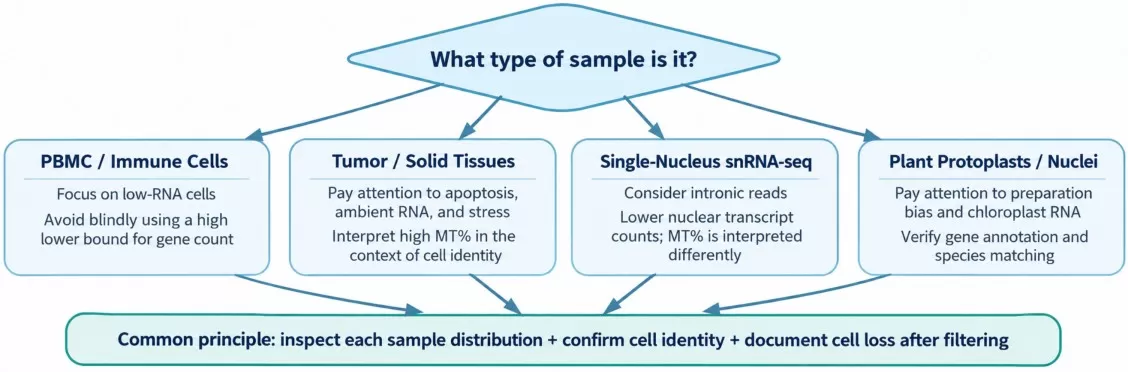
Figure 2 | QC priorities vary among sample types, but the authenticity and retention of cells should always be reassessed.
V. Empty Droplets, Ambient RNA, and Doublets: Distinct Sources of Technical Artifacts
1. Empty Droplets, Low-Quality Cells, and Ambient RNA Are Not Interchangeable
An empty droplet contains no genuine cell, although it may contain background RNA. Ambient RNA consists of extracellular transcripts in the cell suspension and may be present either in empty droplets or in droplets containing genuine cells. A low-quality cell, by contrast, is a captured cell whose RNA content or cellular integrity has been compromised. These problems are distinct and require different approaches.
When the target population includes cells with low RNA content, imposing a fixed minimum UMI count may inadvertently exclude genuine cells. EmptyDrops helps distinguish cell-containing droplets by testing whether their expression profiles differ significantly from the ambient RNA profile. In some datasets, this approach preserves low-RNA-content cells more effectively than a simple UMI cutoff [2].
2. Ambient RNA Correction Addresses Misassigned Transcripts, Not Individual Genes
Following tissue dissociation or cell damage, ambient RNA may produce low-level expression of the same tissue-associated markers across otherwise unrelated cell populations. Signals from genes such as HBB, COL1A1, and ALB should therefore be interpreted in the context of tissue origin and cell identity, rather than addressed by indiscriminately removing those genes. SoupX estimates contamination fractions using the RNA background observed in empty droplets, whereas CellBender uses a modeling framework to identify background noise. The two methods are suited to different data and computational requirements. After correction, marker specificity, cell-population structure, and differential expression results should be reassessed [3–4].
3. Doublet Detection: Recognize Cross-Lineage Coexpression Without Excluding Genuine Large Cells
Doublets or multiplets result from the co-capture of two or more cells. They may exhibit unusually high UMI and gene counts, together with coexpression of markers from distinct cell lineages. DoubletFinder and scDblFinder identify likely doublets using simulated doublets and classification or neighborhood-based information. Homotypic doublets, composed of cells of the same type, are particularly difficult to detect. Consequently, the proportion of doublets identified computationally does not necessarily equal the true multiplet rate.
Doublet detection should not be applied indiscriminately to pooled data from different libraries or samples without accounting for their origins. Instead, the analysis should be performed separately for each capture channel or sample, with the expected doublet rate estimated from platform loading conditions. Suspected doublets should then be reviewed in terms of marker expression and their positions within clusters. The scDblFinder documentation specifically notes that expected doublet rates depend on captured cell counts and platform chemistry and should not be assumed to be uniformly 5%–10%.
| Issue | Defining characteristic | Representative methods | Common pitfall |
|---|---|---|---|
| Empty droplets | Background RNA without a genuine captured cell | Cell Ranger cell calling; EmptyDrops | Classifying every droplet with low UMI counts as empty |
| Ambient RNA | Transcripts from other populations are assigned to genuine cells | SoupX; CellBender | Assuming that removing HBB or COL1A1 eliminates contamination |
| Doublets | Transcripts from multiple cells share one barcode | scDblFinder; DoubletFinder; experimental labeling as supporting evidence | Using high detected gene counts in place of formal doublet detection |
| Damaged cells | Reduced library complexity, abnormal MT%, or stress-related signals | Joint assessment of QC metrics and cell identity | Relying on MT% alone to determine whether a cell is retained |
VI. Practical Examples: How Are QC Decisions Made?
Case A: Treatment Versus Control—How Uniform Thresholds Can Introduce Bias
Consider a drug-treated group and a control group, each containing 10,000 cells before filtering. After applying the same MT% threshold, the control group retains 8,500 cells (85%), whereas the treated group retains only 4,000 (40%). This difference does not by itself establish that the threshold is inappropriate. It does, however, warrant further investigation: Did treatment induce genuine biological damage? Do particular cell types naturally exhibit elevated MT%? Could differences in sample preparation or batch effects explain the discrepancy?
| Group (illustrative) | Before filtering | After filtering | Retention rate | Additional checks |
|---|---|---|---|---|
| Control | 10,000 | 8,500 | 85% | Review excluded cell types and their markers |
| Treatment | 10,000 | 4,000 | 40% | Assess selective loss of target cells, batch effects, and cellular stress |
Practical steps:
1) Examine distributions before filtering. Plot detected gene counts, total UMI counts, and mitochondrial transcript proportions for each sample using violin or density plots, colored by experimental group, to identify potential systematic differences between groups.
2) Quantify cell loss by group. Record the number of cells before and after filtering in each sample. If a sample loses a substantially higher fraction of cells than others (for example, >50%), reassess the suitability of the thresholds.
3) Consider group-specific thresholds when justified. If QC metric distributions differ markedly between groups, thresholds may be set separately by group. Alternatively, more permissive filtering can be followed by correction of technical effects, such as regression-based adjustment, during downstream analysis.
4) Maintain a filtering log. Record the criteria used at each filtering step and the number of affected cells to ensure traceability and reproducibility.
Case B: SoupX Kidney Tumor Study—Recovering Cell-Type Specificity After Ambient RNA Correction
In the published SoupX study, Young and Behjati examined kidney tumor data and identified background expression of collagen genes in certain T-cell and mononuclear phagocyte populations, as well as hemoglobin-associated signals in nonerythroid cells. After ambient RNA correction, several markers showed improved cell-type specificity, and some cluster assignments changed. This example illustrates that unexpected marker expression does not always indicate genuine mixed-cell profiles; it may instead reflect transcripts incorrectly attributed to cells because of tissue-derived ambient RNA [3].
Case C: Seurat PBMC 3K Tutorial—Transparent, Reproducible Filtering
The official Seurat tutorial analyzes approximately 2,700 PBMCs. It first visualizes the distributions of nFeature, nCount, and percent.mt using violin plots and scatter plots, then demonstrates filtering cells with nFeature >200 and <2,500 and percent.mt <5%. The key lesson is not that every dataset requires a 5% mitochondrial cutoff, but that the data distributions should be examined, filtering decisions justified, and thresholds documented for reproducibility.
A reproducible scRNA-seq QC report should contain more than the total number of cells retained after filtering. At a minimum, it should document the preparation or processing method for each sample, initial and final cell counts, the number of cells removed at each stage and the reasons for their removal, the applied thresholds and software versions, key QC distribution plots, and how samples that failed QC were handled.
VII. Frequently Asked Questions (FAQ)
Q1. Can doubling the sequencing depth rescue low-quality cells?
Not necessarily. When sequencing depth is insufficient, additional reads may improve transcript detection. However, if the principal limitations are cell damage, low library complexity, or ambient RNA contamination, deeper sequencing cannot necessarily recover RNA that has already been lost.
Q2. Should every cell with a mitochondrial transcript proportion above 20% be removed?
No. Filtering decisions should account for cell type, UMI and detected gene counts, cellular stress, and sample-specific distributions. A 20% cutoff is not a universally applicable acceptance criterion.
Q3. Can doublets be identified simply by selecting cells with high nFeature values?
No. Baseline RNA content varies considerably among cell types, so a high nFeature value does not necessarily indicate a doublet. Homotypic doublets are especially challenging to identify.
Q4. Should identical QC thresholds be applied to all samples?
QC criteria should be transparent and support valid comparisons across experimental groups. Nevertheless, samples may differ in sequencing depth, tissue composition, and cell populations. Predetermined baseline criteria can be combined with sample-specific distribution checks, independent outlier detection, and sensitivity analyses to avoid arbitrary post hoc adjustments intended to favor particular results.
Q5. When should experimental procedures be reassessed rather than computational thresholds adjusted further?
If most samples exhibit poorly defined separation in barcode-rank plots, extensive cell aggregation or debris, high ambient RNA levels, or consistently poor cell integrity within a batch, sample preparation and library construction should be evaluated first. Computational filtering cannot recover cell types that were lost during sample processing.
Conclusion: Preserving Genuine Cells Matters More Than Meeting an Arbitrary Threshold
Effective scRNA-seq QC should address three fundamental questions: Are the detected cells genuine? Are their expression profiles sufficiently reliable? Have the QC criteria systematically affected comparability across samples? Evaluating these questions throughout sample preparation, sequencing, cell-level assessment, and post-filtering review can substantially reduce the influence of technical noise on clustering, cell-type annotation, and downstream biological interpretation. In practice, examine sample and data distributions before choosing thresholds, distinguish contamination from genuine cell signals before applying corrections, and validate the results using cell retention rates and established biological markers. Ultimately, QC is not about excluding the greatest number of cells, but about retaining as much authentic biological information as possible while removing technical artifacts. This principle is essential for drawing reliable biological conclusions from downstream analyses.
Plan Your Single-Cell RNA-seq Study with MetwareBio
Planning a single-cell or single-nucleus RNA-seq study? MetwareBio supports sample evaluation, cell or nuclei preparation, high-throughput sequencing, and downstream bioinformatics analysis, including quality control, cell filtering, clustering, and cell-type annotation. Our team can help assess sample requirements and experimental design considerations to support reliable single-cell transcriptome profiling across different tissues and research applications. Contact us to discuss a workflow aligned with your biological question and sample characteristics.
Contact UsRead More: From QC to Omics Data Analysis
Once your single-cell or bulk omics data pass QC, the next challenge is sound statistical analysis. The articles below cover the multivariate and differential analysis methods that turn clean data into biological insight.
An overview of scRNA-seq principles, technology choices, and research applications, including single-cell versus single-nucleus approaches. Helps place QC decisions within the broader context of study design, sample preparation, and biological interpretation.
Learn how to build and read correlation heatmaps, choose between Pearson and Spearman, and use clustering to reveal structure. Useful for examining relationships among QC metrics or expression features after filtering.
A practical introduction to weighted gene co-expression network analysis, from soft-threshold selection to module-trait association and hub gene identification. Applied to RNA-seq datasets, it complements cell-level QC with module-level biology.
Understand what each screening metric actually measures and how to combine them into a layered, defensible candidate list. Especially relevant after group-imbalanced filtering, as discussed in the treatment-versus-control example above.
Follow the scRNA-seq workflow from cell isolation and library preparation to normalization, batch correction, clustering, and cell-type annotation. A practical continuation of this QC guide, showing how filtered data move into downstream analysis.
A practical guide to connecting transcriptomics, proteomics, and metabolomics in the same biological system. Shows how validated single-omics data, starting from reliable QC, feed into cross-layer regulatory interpretation.
References
- Heumos L, et al. Best practices for single-cell analysis across modalities. Nature Reviews Genetics. 2023. https://doi.org/10.1038/s41576-023-00586-w
- Lun ATL, et al. EmptyDrops: distinguishing cells from empty droplets in droplet-based single-cell RNA sequencing data. Genome Biology. 2019;20:63. https://doi.org/10.1186/s13059-019-1662-y
- Young MD, Behjati S. SoupX removes ambient RNA contamination from droplet-based single-cell RNA sequencing data. GigaScience. 2020;9:giaa151. https://doi.org/10.1093/gigascience/giaa151
- Fleming SJ, et al. Unsupervised removal of systematic background noise from droplet-based single-cell experiments using CellBender. Nature Methods. 2023. https://doi.org/10.1038/s41592-023-01943-7