Gene Ontology (GO) enrichment analysis is widely used in transcriptomics, proteomics, metabolomics, and multi-omics studies to interpret lists of differentially expressed or significant molecules from a biological perspective. Rather than focusing only on individual genes or proteins, GO enrichment analysis identifies biological processes, molecular functions, and cellular components that are statistically overrepresented in a selected gene set.
However, interpreting GO enrichment results requires careful understanding of several statistical indicators, including GeneRatio, BgRatio, p-value, and false discovery rate (FDR). These parameters determine whether an enriched GO term represents a meaningful biological pattern or a statistical artifact.
What Is GO Enrichment Analysis?
Definition and Biological Significance of GO
Gene Ontology (GO) is a standardized biological knowledge framework designed to describe gene and gene product functions across different organisms. It provides a common language for annotating molecular functions, biological processes, and cellular locations, allowing researchers to compare functional information across species and experimental platforms.
Each GO term represents a specific biological concept and is assigned a unique identifier. Terms are connected through structured relationships, allowing biological functions to be analyzed from broad cellular activities to highly specific molecular events.
For example, a gene involved in immune regulation may be associated with:
- a broad term such as “immune system process”;
- an intermediate term such as “regulation of immune response”;
- a specific term such as “cytokine-mediated signaling pathway”.
This hierarchical structure enables researchers to examine biological functions at different levels of resolution.
The Gene Ontology Consortium continuously updates GO annotations by integrating experimental evidence, computational predictions, and curated biological knowledge, making GO one of the most important resources for functional genomics and multi-omics interpretation (Gene Ontology Consortium, 2021; Gene Ontology Consortium, 2023).
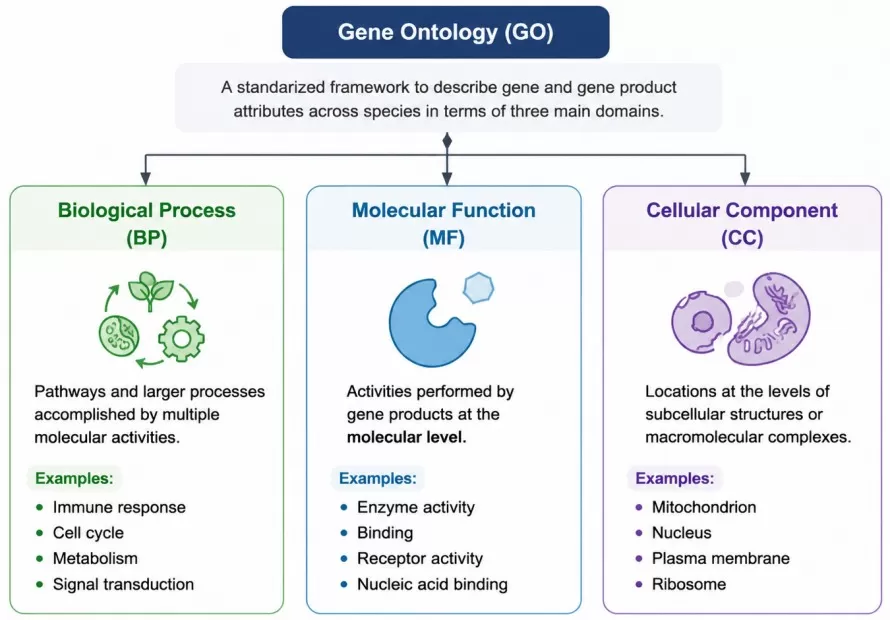
Figure 1. Gene Ontology (GO) Three Domains Overview. Image adapted from Gene Ontology Consortium. The Gene Ontology resource: enriching a GOld mine. Nucleic Acids Research. 2021;49(D1):D325–D334.
Why Is GO Analysis Important in Omics Research?
High-throughput technologies generate large amounts of molecular information, but molecular measurements alone do not immediately reveal biological mechanisms.
For example, RNA sequencing may identify hundreds or thousands of differentially expressed genes between two experimental conditions. Although these genes provide valuable molecular evidence, understanding their collective biological meaning requires functional interpretation.
If genes associated with a particular function appear significantly more often than expected, that function is considered enriched.
For example, a disease-related transcriptomics study may identify genes involved in:
- inflammatory signaling;
- oxidative stress response;
- cell cycle regulation;
- extracellular matrix remodeling.
Rather than examining each gene individually, GO analysis reveals coordinated biological programs that may contribute to the observed phenotype.
The Structure and Organization of the Gene Ontology Database
GO as a Hierarchical Functional Knowledge System
The Gene Ontology database is organized as a directed acyclic graph (DAG), where each functional term has relationships with broader and more specific terms.
Unlike a simple classification system, GO allows one biological concept to connect with multiple related concepts.
For example:
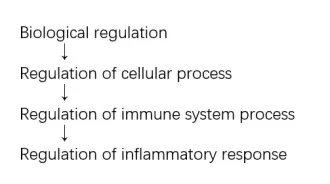
A single gene can therefore belong to multiple functional categories because biological functions are interconnected.
For instance, a transcription factor may participate in:
- DNA binding;
- transcription regulation;
- stress response;
- cellular signaling.
The Three Major Categories of GO Annotation
Biological Process (BP): Understanding Coordinated Cellular Activities
Biological Process (BP) describes biological events that involve multiple molecular components working together to achieve a specific cellular outcome.
Unlike individual molecular activities, biological processes represent coordinated programs within cells and organisms. Examples include immune regulation, DNA repair, cell cycle progression, metabolic regulation, and stress responses.
BP enrichment is particularly common in transcriptomics research because changes in gene expression often reflect altered cellular programs.
For example, an RNA-seq study investigating inflammatory disease may identify enrichment of biological processes related to cytokine signaling, leukocyte activation, and immune regulation. These results suggest that the disease condition is associated with coordinated activation of immune-related transcriptional programs.
Molecular Function (MF): Identifying Altered Biochemical Activities
Molecular Function (MF) describes the specific biochemical activities performed by gene products.
These functions include enzymatic reactions, molecular binding activities, transporter functions, and regulatory activities.
MF enrichment provides information about the molecular capabilities affected by an experimental condition.
For instance, proteomic analysis may reveal enrichment of catalytic activity, oxidoreductase activity, or protein-binding functions, suggesting changes in enzymatic regulation or molecular interactions.
Cellular Component (CC): Revealing Molecular Localization Changes
Cellular Component (CC) describes where gene products function within cells. This category provides information about the spatial organization of biological activity.
CC enrichment can reveal whether molecular changes are associated with specific cellular structures, including organelles, membranes, protein complexes, or extracellular regions.
This information is particularly valuable in proteomics studies because changes in protein abundance may reflect altered organelle activity, cellular remodeling, or changes in protein localization.
For example, enrichment of mitochondrial-associated GO terms may indicate changes in energy metabolism and oxidative phosphorylation, whereas enrichment of extracellular matrix-related terms may suggest changes in tissue remodeling or cell–environment interactions.
How Does GO Enrichment Analysis Work?
From Molecular Lists to Biological Interpretation
GO enrichment analysis is a computational approach that converts a list of genes, proteins, or other molecular features into biologically meaningful functional information. The central question behind enrichment analysis is whether certain biological functions appear more frequently within an experimental dataset than would be expected by chance.
In a typical omics study, the workflow begins with the identification of molecular features associated with a biological condition. These features may include differentially expressed genes from RNA sequencing, altered proteins from mass spectrometry-based proteomics, or integrated molecular signatures from multi-omics studies.
The selected molecular list is then compared with a reference background population. If a GO term contains more associated genes than expected according to the background distribution, that functional category is considered enriched.
For example, an RNA-seq experiment may identify 600 differentially expressed genes. GO enrichment analysis may reveal that these genes are significantly associated with immune activation, oxidative stress response, and metabolic regulation. These enriched terms provide a functional interpretation of the molecular changes observed in the experiment.
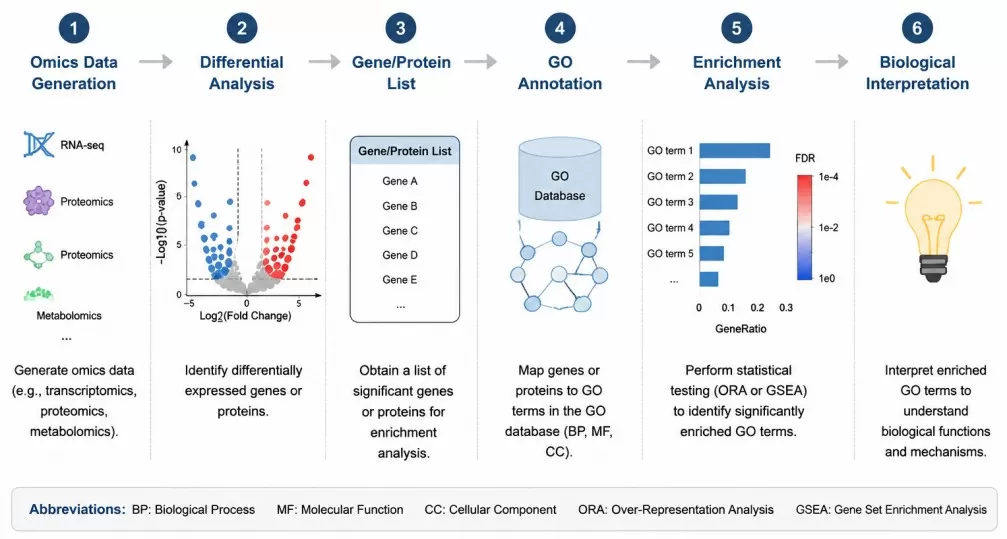
Figure 2. Workflow of GO enrichment analysis from omics data generation, differential analysis, GO annotation, enrichment testing, and biological interpretation. Image adapted from Gene Ontology Consortium. The Gene Ontology resource: enriching a GOld mine. Nucleic Acids Research. 2021;49(D1):D325–D334.
The Core Workflow of GO Enrichment Analysis
Molecular Feature Selection and Functional Annotation
The first step is generating a biologically meaningful input dataset.
For transcriptomics studies, the input usually consists of differentially expressed genes identified through statistical analysis of RNA sequencing data. In proteomics studies, altered proteins identified through quantitative mass spectrometry are commonly used. In multi-omics studies, molecular features from multiple platforms may be integrated before functional analysis.
After obtaining the molecular list, each feature is mapped to GO annotations. This process links genes or proteins with known biological functions, allowing enrichment algorithms to evaluate functional representation.
The quality of GO enrichment results depends strongly on annotation accuracy. Incomplete annotation, species differences, and database coverage may influence the final interpretation.
Enrichment Statistical Testing
After annotation mapping, enrichment analysis compares two populations:
- Target gene set: molecules identified from the experiment.
- Background gene set: all molecules that could potentially have been selected.
The statistical model evaluates whether a GO term occurs more frequently in the target dataset than expected.
Common statistical approaches include:
- hypergeometric test;
- Fisher’s exact test;
- ranking-based enrichment methods.
The output typically contains enriched GO terms together with statistical indicators such as GeneRatio, BgRatio, p-value, adjusted p-value, and FDR.
Over-Representation Analysis (ORA) and Gene Set Enrichment Analysis (GSEA)
GO enrichment analysis can be performed using different statistical strategies. The two most widely applied approaches are Over-Representation Analysis (ORA) and Gene Set Enrichment Analysis (GSEA). (Learn more at: ORA vs GSEA: Choosing the Right Pathway Enrichment Method)
Although both methods aim to identify biologically meaningful functional patterns, they differ in how input data are defined and how statistical enrichment is calculated.
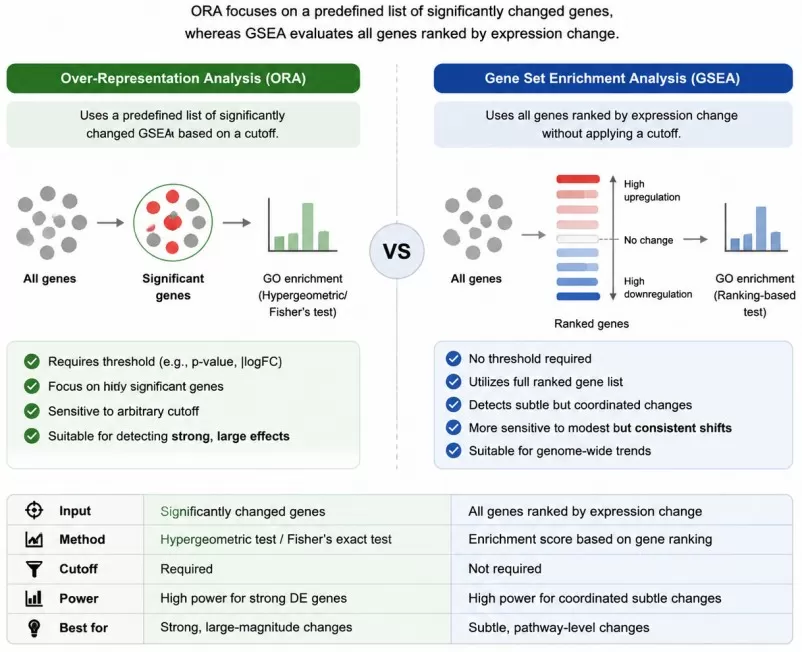
Figure 3. Comparison between Over-Representation Analysis (ORA) and Gene Set Enrichment Analysis (GSEA) approaches for functional enrichment analysis. Image adapted from Wu T, Hu E, Xu S, et al. clusterProfiler 4.0: A universal enrichment tool for interpreting omics data. The Innovation. 2021;2(3):100141.
Over-Representation Analysis (ORA)
ORA evaluates whether specific GO terms are overrepresented among a predefined list of significant genes or proteins.
The typical workflow is:
Differential analysis
→ Significant molecule selection
→ GO annotation
→ Enrichment testing
For example, researchers may select genes with adjusted p-value below a defined threshold and then perform GO enrichment analysis on this subset.
ORA is widely used because of its straightforward interpretation. When a clear set of significantly altered molecules has been identified, ORA provides a direct method for identifying associated biological functions.
However, ORA depends heavily on the cutoff used to define significant molecules. Genes with moderate but coordinated changes may be excluded if they do not pass the selected threshold.
Gene Set Enrichment Analysis (GSEA)
GSEA evaluates biological trends across an entire ranked molecular dataset rather than using only selected significant molecules.
Instead of separating genes into significant and non-significant groups, GSEA ranks genes according to characteristics such as:
- expression change;
- correlation with phenotype;
- statistical significance.
The method then determines whether genes belonging to a specific GO category tend to accumulate at the top or bottom of the ranked list.
This approach is useful when biological pathways are affected by coordinated changes across many genes, even if individual genes show only moderate alterations.
Statistical Principles Behind GO Enrichment Analysis
Understanding Enrichment as a Probability Problem
GO enrichment analysis is based on the concept of statistical overrepresentation.
The fundamental question is:
If molecules were randomly selected from the background population, how likely would it be to observe the same number of genes associated with a specific GO term?
For example, suppose:
- The genome contains 20,000 annotated genes.
- A specific GO term contains 500 genes.
- An experiment identifies 400 significant genes.
- Among these genes, 50 belong to that GO category.
The enrichment algorithm evaluates whether finding 50 genes is greater than expected by random selection.
If the probability is sufficiently low, the GO term is considered statistically enriched.
Interpreting GeneRatio in GO Enrichment Results
Definition of GeneRatio
GeneRatio describes the proportion of genes in the input dataset that are associated with a specific GO term.
The calculation is:
GeneRatio = Number of genes associated with a GO term / Total number of genes in the input list
For example, if an experiment identifies 500 significant genes and 50 of these genes are annotated with “oxidative stress response,” the GeneRatio is:
50 / 500 = 0.10
This indicates that 10% of the input genes contribute to this biological function.
Biological Meaning of GeneRatio
A higher GeneRatio indicates that a larger proportion of experimental molecules are associated with a particular function. However, GeneRatio should not be interpreted as an independent measure of biological importance.
Large GO categories may naturally contain many genes, resulting in higher GeneRatio values. Broad categories such as cellular processes or metabolic functions often appear frequently because they cover a large proportion of annotated genes.
Therefore, GeneRatio must be interpreted together with background frequency and statistical significance.
Relationship Between GeneRatio and BgRatio
The comparison between these two values determines whether enrichment exists.
For example:
| Parameter | Value |
|---|---|
| GeneRatio | 0.20 |
| BgRatio | 0.03 |
The GO term appears approximately six times more frequently in the experimental dataset than expected, suggesting strong enrichment.
In contrast:
| Parameter | Value |
|---|---|
| GeneRatio | 0.20 |
| BgRatio | 0.18 |
Although the GeneRatio is high, the enrichment effect is weak because the biological function is already common in the background population.
How to Correctly Interpret GO Enrichment Results?
GO enrichment analysis provides statistical evidence linking molecular changes with biological functions. However, meaningful interpretation requires integrating enrichment strength, statistical reliability, and biological context rather than selecting GO terms solely based on p-value.
A reliable interpretation usually considers four key parameters together: GeneRatio, BgRatio, p-value, and FDR.
GeneRatio reflects the proportion of molecules from the experimental dataset associated with a GO term, while BgRatio represents the expected frequency of that function in the background population. A GO term is more likely to represent true enrichment when the observed GeneRatio is substantially higher than the BgRatio.
Because GO analysis evaluates hundreds or thousands of functional categories simultaneously, multiple-testing correction is essential. FDR-adjusted values provide a more reliable measurement of enrichment confidence than raw p-values alone (Wu et al., 2021; Mubeen et al., 2022).
GO Enrichment Visualization and Functional Interpretation
GO enrichment results are commonly visualized using dot plots, bar plots, and enrichment networks. These visualization methods help researchers identify biological functions that combine strong enrichment with statistical significance.
In a typical GO dot plot, GeneRatio represents enrichment magnitude, dot size indicates the number of associated genes, and color represents statistical significance. This integrated visualization allows rapid identification of major biological themes.
Because GO terms are organized hierarchically, multiple enriched terms may describe similar biological concepts. Functional clustering and semantic similarity analysis can reduce redundancy and highlight major biological processes (Li et al., 2022; Huang et al., 2023).
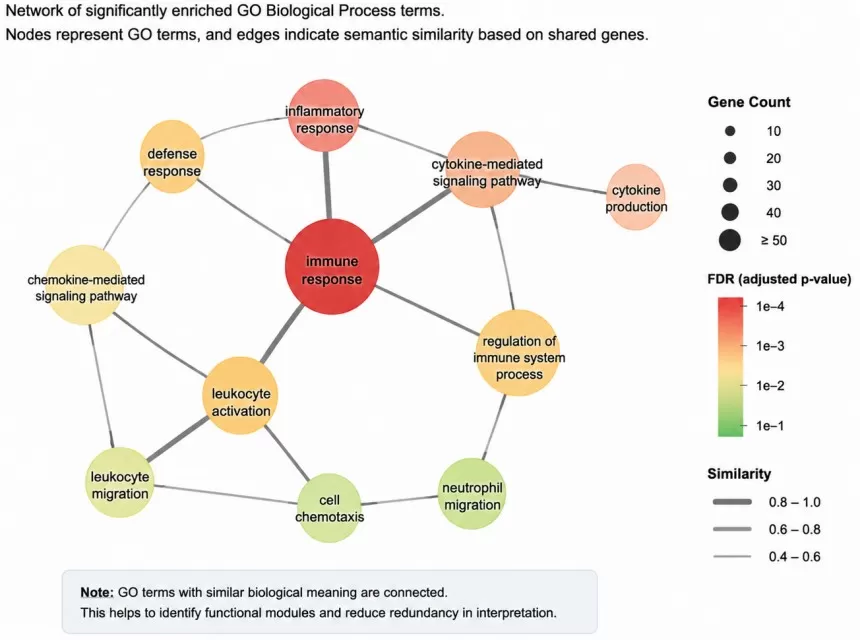
Figure 4. GO term similarity network showing functional relationships among enriched biological processes based on shared genes and semantic similarity. Image adapted from Li Y, Zhou B, Liu B, Chen X, Wang J. MonaGO: A novel gene ontology enrichment analysis and visualization system. BMC Bioinformatics. 2022;23:190.
Applications of GO Enrichment Analysis in Multi-Omics Research
Transcriptomics and Proteomics Functional Interpretation
GO enrichment analysis is widely applied in transcriptomics studies to interpret differentially expressed genes. By identifying enriched biological processes, GO analysis helps reveal cellular responses associated with disease progression, environmental stress, or treatment effects.
In proteomics research, GO analysis provides additional functional information by linking altered proteins with molecular activities and cellular localization. For example, enrichment of mitochondrial-related GO terms may indicate changes in energy metabolism, whereas extracellular matrix-related terms may suggest tissue remodeling.
Multi-Omics Integration
With the development of integrated omics approaches, GO enrichment analysis has become an important tool for connecting molecular changes across different biological layers.
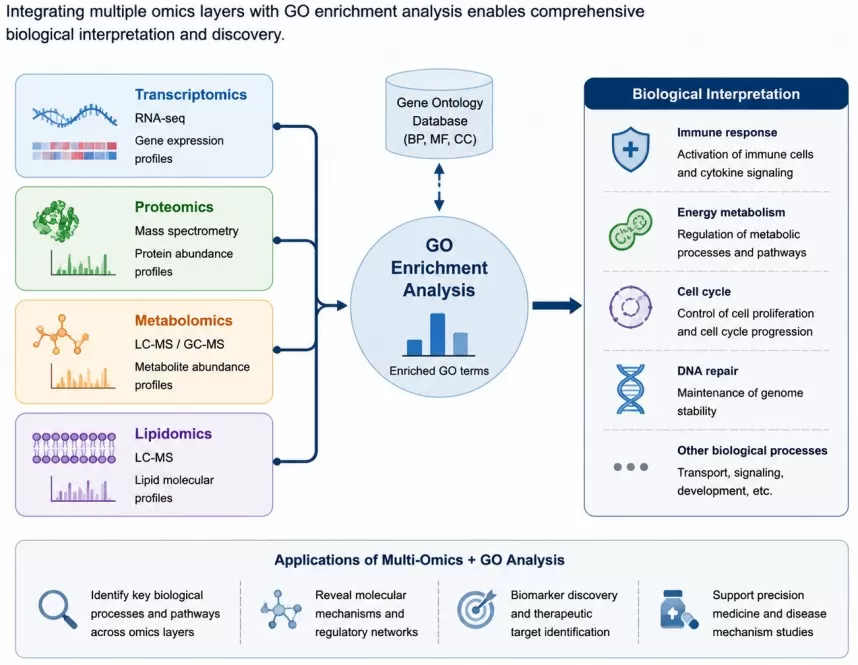
Figure 5. Integration of transcriptomics, proteomics, metabolomics, and lipidomics with GO enrichment analysis for multi-omics biological interpretation. Image adapted from Argelaguet R, Arnol D, Bredikhin D, et al. MOFA+: A statistical framework for comprehensive integration of multi-modal single-cell data. Genome Biology. 2021;22:111.
Transcriptomics can reveal altered gene regulation, proteomics can provide evidence of functional protein changes, and metabolomics can capture downstream metabolic consequences. GO-based interpretation helps identify shared biological processes connecting these molecular levels.
Challenges and Best Practices in GO Analysis
Although GO enrichment analysis is widely used, several factors should be considered to ensure reliable interpretation.
The selection of an appropriate background gene set is critical because enrichment statistics depend on expected functional frequencies. Using all genomic genes as background may introduce bias when only a subset of genes or proteins was experimentally detectable (Mubeen et al., 2022).
In addition, GO terms often overlap because of their hierarchical organization. Combining enrichment results with network visualization and functional clustering can improve interpretation by focusing on major biological themes rather than individual redundant terms.
Finally, GO enrichment identifies statistical associations rather than direct biological mechanisms. Functional conclusions should therefore be supported by additional evidence, including pathway analysis, molecular networks, and experimental validation.
How MetwareBio Supports GO Enrichment and Multi-Omics Data Analysis
Functional interpretation is a critical step in transforming large-scale omics datasets into biological insights. While GO enrichment analysis provides a powerful framework for identifying biological functions associated with molecular changes, accurate interpretation requires appropriate statistical methods, high-quality annotation, and integration with complementary omics information.
MetwareBio provides comprehensive multi-omics analysis solutions covering transcriptomics, proteomics, metabolomics, lipidomics, and multi-omics integration. GO enrichment analysis can be incorporated into customized bioinformatics workflows to identify biological processes, molecular functions, and cellular components associated with experimental conditions.
By combining functional enrichment analysis with pathway analysis, molecular interaction networks, and multi-layer omics integration, researchers can obtain a more systematic understanding of disease mechanisms, biological regulation, and molecular responses.
For studies involving complex biological systems, MetwareBio supports researchers through:
- professional bioinformatics analysis workflows;
- multi-omics data integration;
- functional annotation and enrichment interpretation;
- biological visualization and reporting.
Conclusion: GO Analysis as a Bridge Between Molecular Data and Biological Meaning
Gene Ontology (GO) enrichment analysis provides a standardized approach for translating complex molecular datasets into biological knowledge.
By connecting genes and proteins with functional categories, GO analysis helps researchers identify biological patterns hidden within large-scale omics datasets.
The interpretation of GO results requires understanding the relationship between different statistical parameters. GeneRatio reflects the proportion of experimental molecules associated with a GO term, BgRatio represents expected background frequency, p-value measures statistical evidence, and FDR evaluates reliability after multiple-testing correction.
Rather than relying on a single statistical indicator, meaningful GO interpretation requires integrating enrichment statistics with biological context and complementary experimental evidence.
When combined with transcriptomics, proteomics, metabolomics, and other multi-omics technologies, GO analysis provides an effective strategy for exploring molecular mechanisms, identifying biomarkers, and understanding biological regulation.
FAQ: GO Enrichment Analysis Explained
1. What is GO enrichment analysis?
GO enrichment analysis is a bioinformatics method used to identify biological functions that are statistically overrepresented within a selected gene, protein, or molecular feature list. By mapping molecular features to Gene Ontology categories, GO analysis reveals enriched Biological Processes (BP), Molecular Functions (MF), and Cellular Components (CC). It is widely applied in transcriptomics, proteomics, and multi-omics studies for functional interpretation.
2. What are the three categories of Gene Ontology?
The Gene Ontology framework contains three major functional domains.
- Biological Process (BP) describes coordinated biological events, such as immune regulation, metabolism, DNA repair, and cell cycle control.
- Molecular Function (MF) describes biochemical activities performed by gene products, including enzyme activity, binding activity, and molecular regulation.
- Cellular Component (CC) describes the cellular locations where molecular functions occur, including organelles, protein complexes, and extracellular structures.
3. What does GeneRatio mean in GO enrichment analysis?
GeneRatio represents the proportion of genes or proteins from the input dataset associated with a specific GO term. A higher GeneRatio indicates that a larger proportion of experimental molecules contribute to that functional category. However, GeneRatio should always be interpreted together with BgRatio, p-value, and FDR because highly annotated GO terms may naturally have higher GeneRatio values.
4. What is the difference between GeneRatio and BgRatio?
GeneRatio represents the observed frequency of a GO term within the experimental dataset.
BgRatio represents the expected frequency of the same GO term within the background population.
A GO term is considered enriched when the observed GeneRatio is substantially higher than the expected BgRatio.
5. Why is FDR important in GO enrichment analysis?
GO enrichment analysis typically evaluates hundreds or thousands of functional categories simultaneously. This creates a risk of false-positive discoveries.
FDR correction adjusts statistical significance by considering multiple comparisons. GO terms with lower FDR values generally provide stronger evidence of reliable enrichment.
6. What is the difference between GO enrichment analysis and pathway analysis?
GO enrichment analysis focuses on functional categories based on gene or protein annotations.
Pathway analysis focuses on biological pathways involving molecular interactions and regulatory relationships.
GO analysis is often combined with pathway databases such as KEGG or Reactome to provide a broader biological interpretation.
7. Can GO enrichment analysis be used for proteomics and metabolomics studies?
Yes. GO enrichment is commonly applied to proteomics datasets to interpret altered protein functions and cellular localization.For metabolomics studies, GO analysis is usually integrated through associated genes, enzymes, pathways, or multi-omics networks to connect metabolite changes with biological processes.
Read More: Enrichment Analysis and Omics Data Interpretation
These articles extend the topics covered here, from complementary pathway enrichment methods to the statistical foundations and visualization tools that support reliable GO interpretation in omics research.
A natural complement to GO analysis, KEGG pathway enrichment maps molecular features onto curated biological pathways. Learn how to read Gene Count, Rich Factor, p-values, and FDR to build pathway-level narratives from your enrichment results.
This article provides a practical walkthrough of Gene Set Enrichment Analysis (GSEA), the ranking-based alternative to ORA discussed in the current blog. Understand how GSEA handles continuous expression data and when it outperforms threshold-based methods.
A hands-on tutorial for implementing GO enrichment analysis using the clusterProfiler R package. Covers input preparation, enrichment testing, visualization, and result export — the practical companion to the interpretation framework explained here.
Before running GO enrichment, researchers must first identify significant molecular features. This guide explains how volcano plots combine fold change and statistical significance to support the differential analysis that feeds into enrichment workflows.
Statistical method selection — including the choice between parametric and non-parametric tests for differential analysis — depends on data distribution. This article covers the normality tests that underpin reliable enrichment input generation.
Weighted Gene Co-expression Network Analysis identifies modules of co-regulated genes that can be used as input for GO enrichment. This guide covers how WGCNA complements traditional differential analysis and extends functional interpretation.
References
- Wang, G., Oh, DH. & Dassanayake, M. GOMCL: a toolkit to cluster, evaluate, and extract non-redundant associations of Gene Ontology-based functions. BMC Bioinformatics 21, 139 (2020). https://doi.org/10.1186/s12859-020-3447-4
- Gene Ontology Consortium (2021). The Gene Ontology resource: enriching a GOld mine. Nucleic acids research, 49(D1), D325–D334. https://doi.org/10.1093/nar/gkaa1113
- Wu, T., Hu, E., Xu, S., Chen, M., Guo, P., Dai, Z., Feng, T., Zhou, L., Tang, W., Zhan, L., Fu, X., Liu, S., Bo, X., & Yu, G. (2021). clusterProfiler 4.0: A universal enrichment tool for interpreting omics data. Innovation (Cambridge (Mass.)), 2(3), 100141. https://doi.org/10.1016/j.xinn.2021.100141
- Xin, Z., Cai, Y., Dang, L. T., Burke, H. M. S., Revote, J., Charitakis, N., Bienroth, D., Nim, H. T., Li, Y. F., & Ramialison, M. (2022). MonaGO: a novel gene ontology enrichment analysis visualisation system. BMC bioinformatics, 23(1), 69. https://doi.org/10.1186/s12859-022-04594-1
- Gene Ontology Consortium, Aleksander, S. A., Balhoff, J., Carbon, S., Cherry, J. M., Drabkin, H. J., Ebert, D., Feuermann, M., Gaudet, P., Harris, N. L., Hill, D. P., Lee, R., Mi, H., Moxon, S., Mungall, C. J., Muruganugan, A., Mushayahama, T., Sternberg, P. W., Thomas, P. D., Van Auken, K., … Westerfield, M. (2023). The Gene Ontology knowledgebase in 2023. Genetics, 224(1), iyad031. https://doi.org/10.1093/genetics/iyad031
- Mubeen, S., Tom Kodamullil, A., Hofmann-Apitius, M., & Domingo-Fernández, D. (2022). On the influence of several factors on pathway enrichment analysis. Briefings in bioinformatics, 23(3), bbac143. https://doi.org/10.1093/bib/bbac143
- Thanati, F., Karatzas, E., Baltoumas, F. A., Stravopodis, D. J., Eliopoulos, A. G., & Pavlopoulos, G. A. (2021). FLAME: A Web Tool for Functional and Literature Enrichment Analysis of Multiple Gene Lists. Biology, 10(7), 665. https://doi.org/10.3390/biology10070665